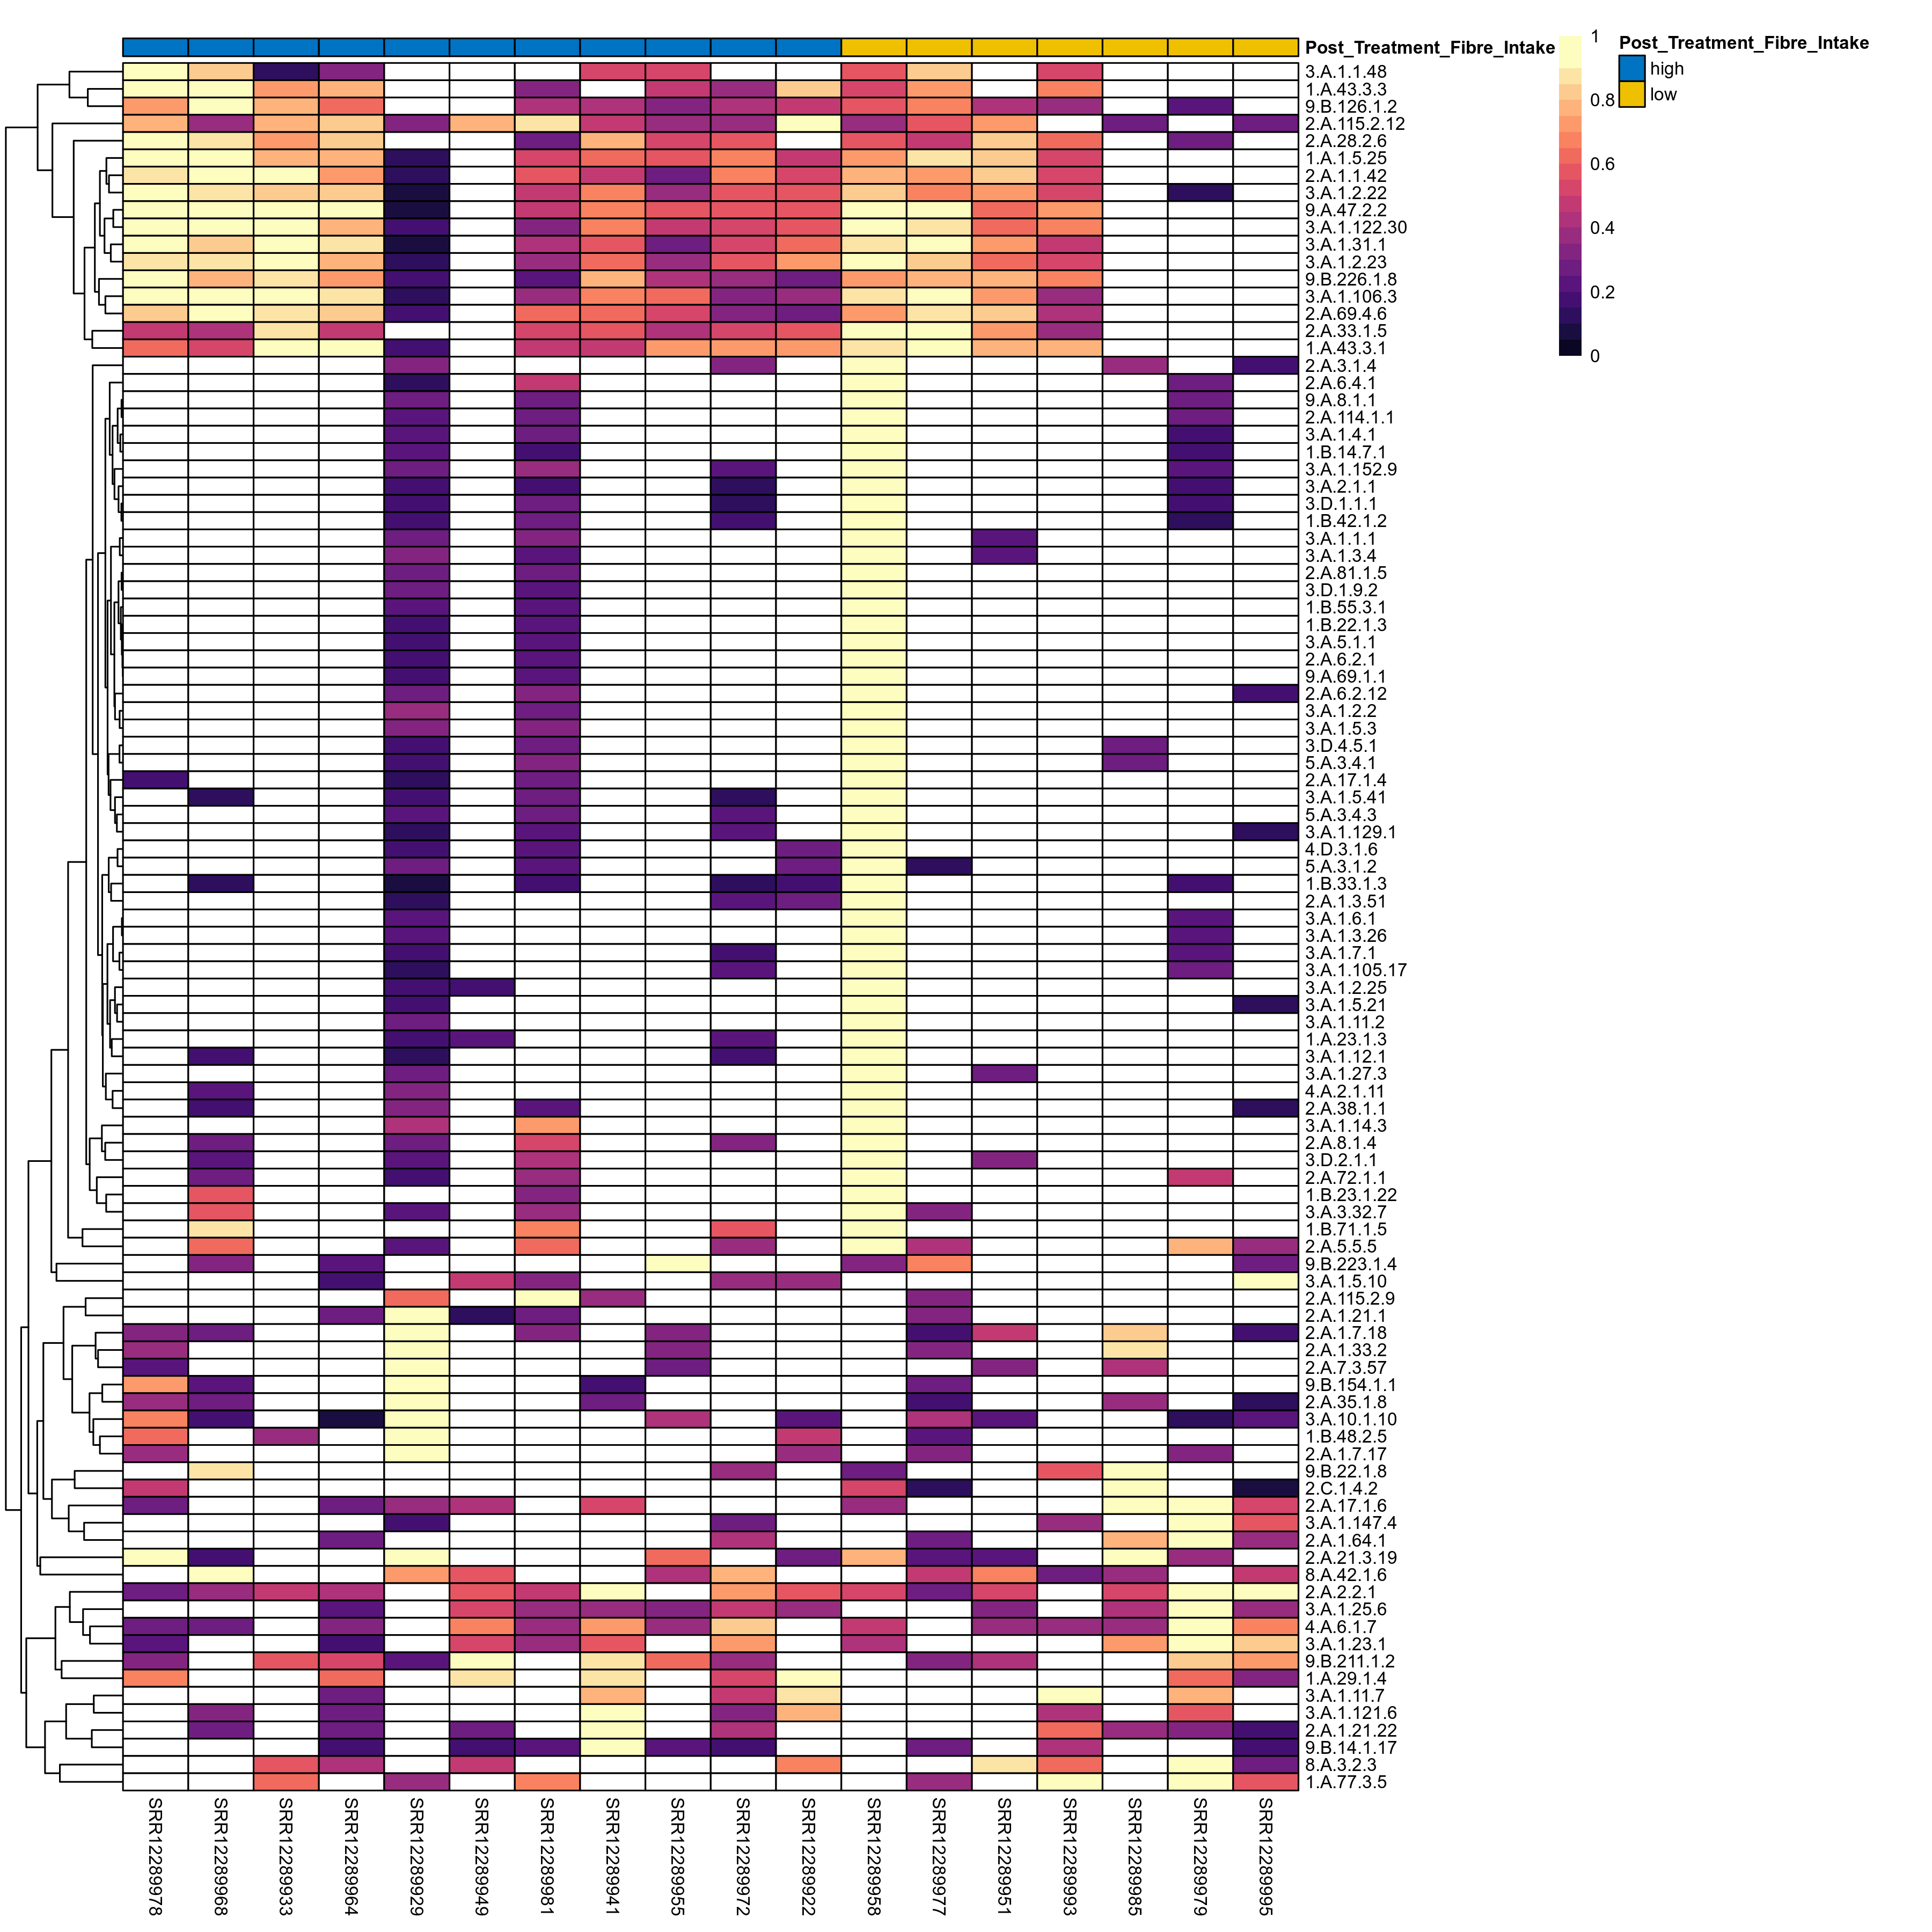
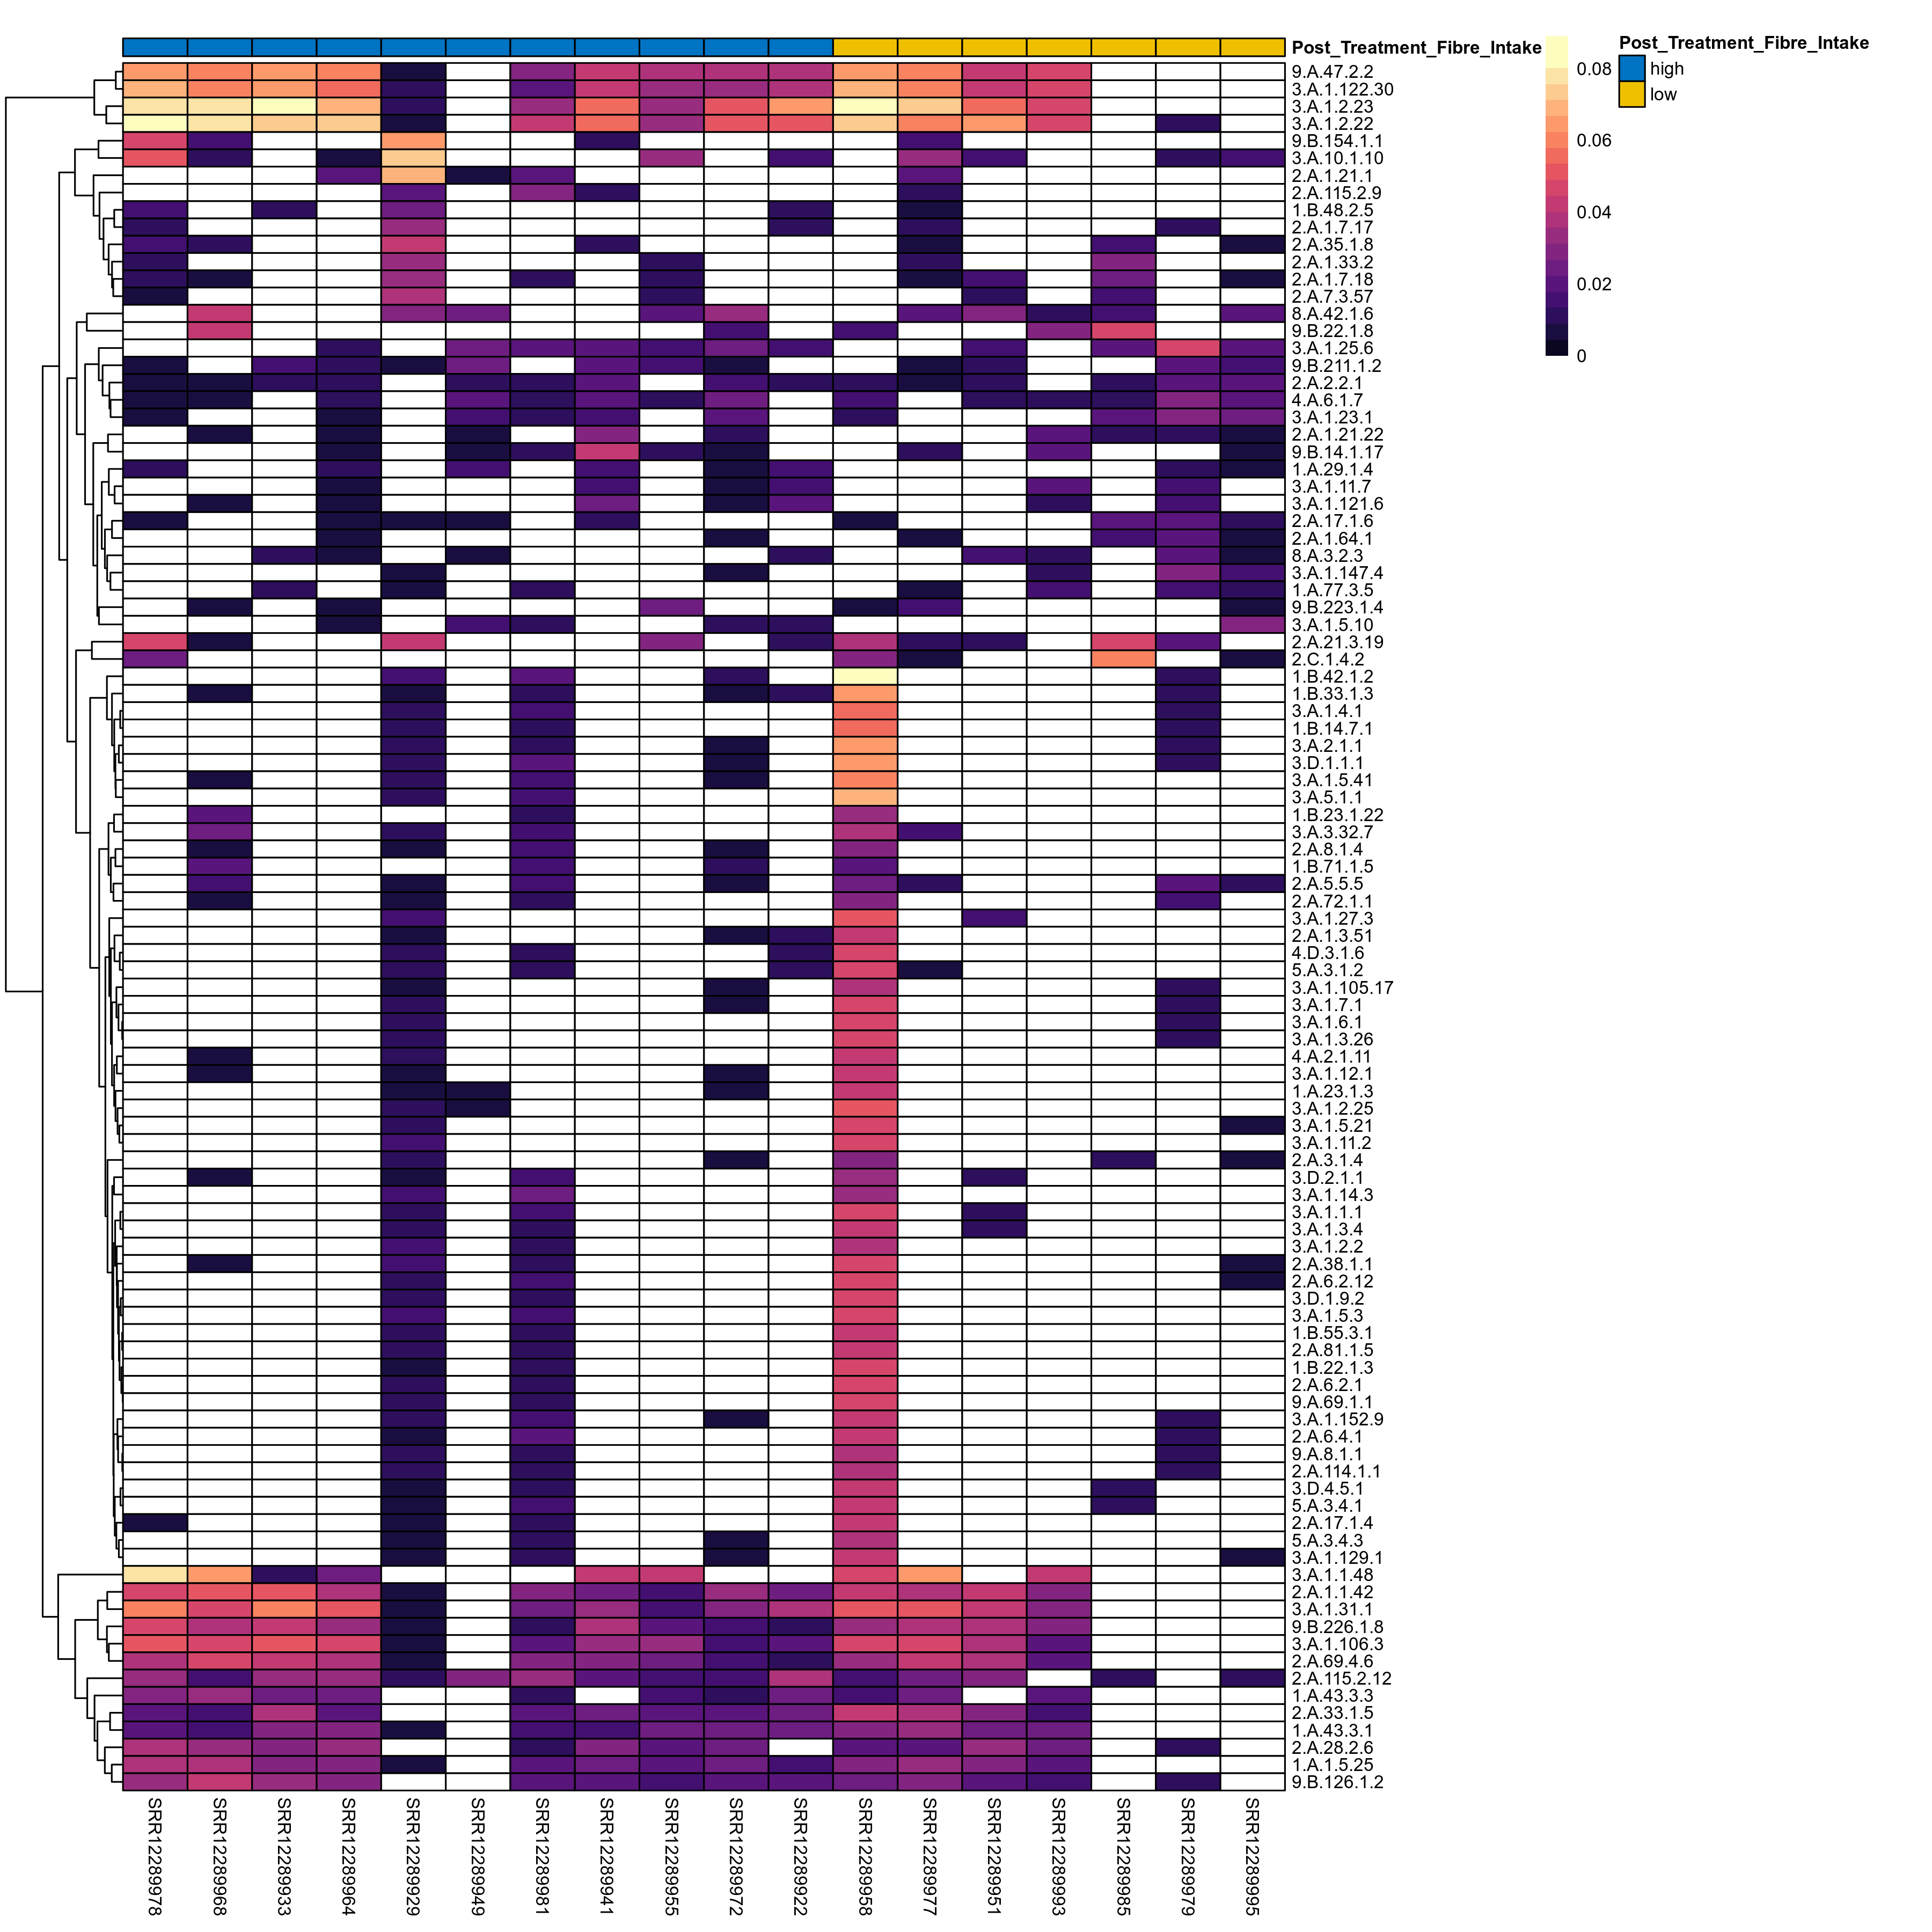
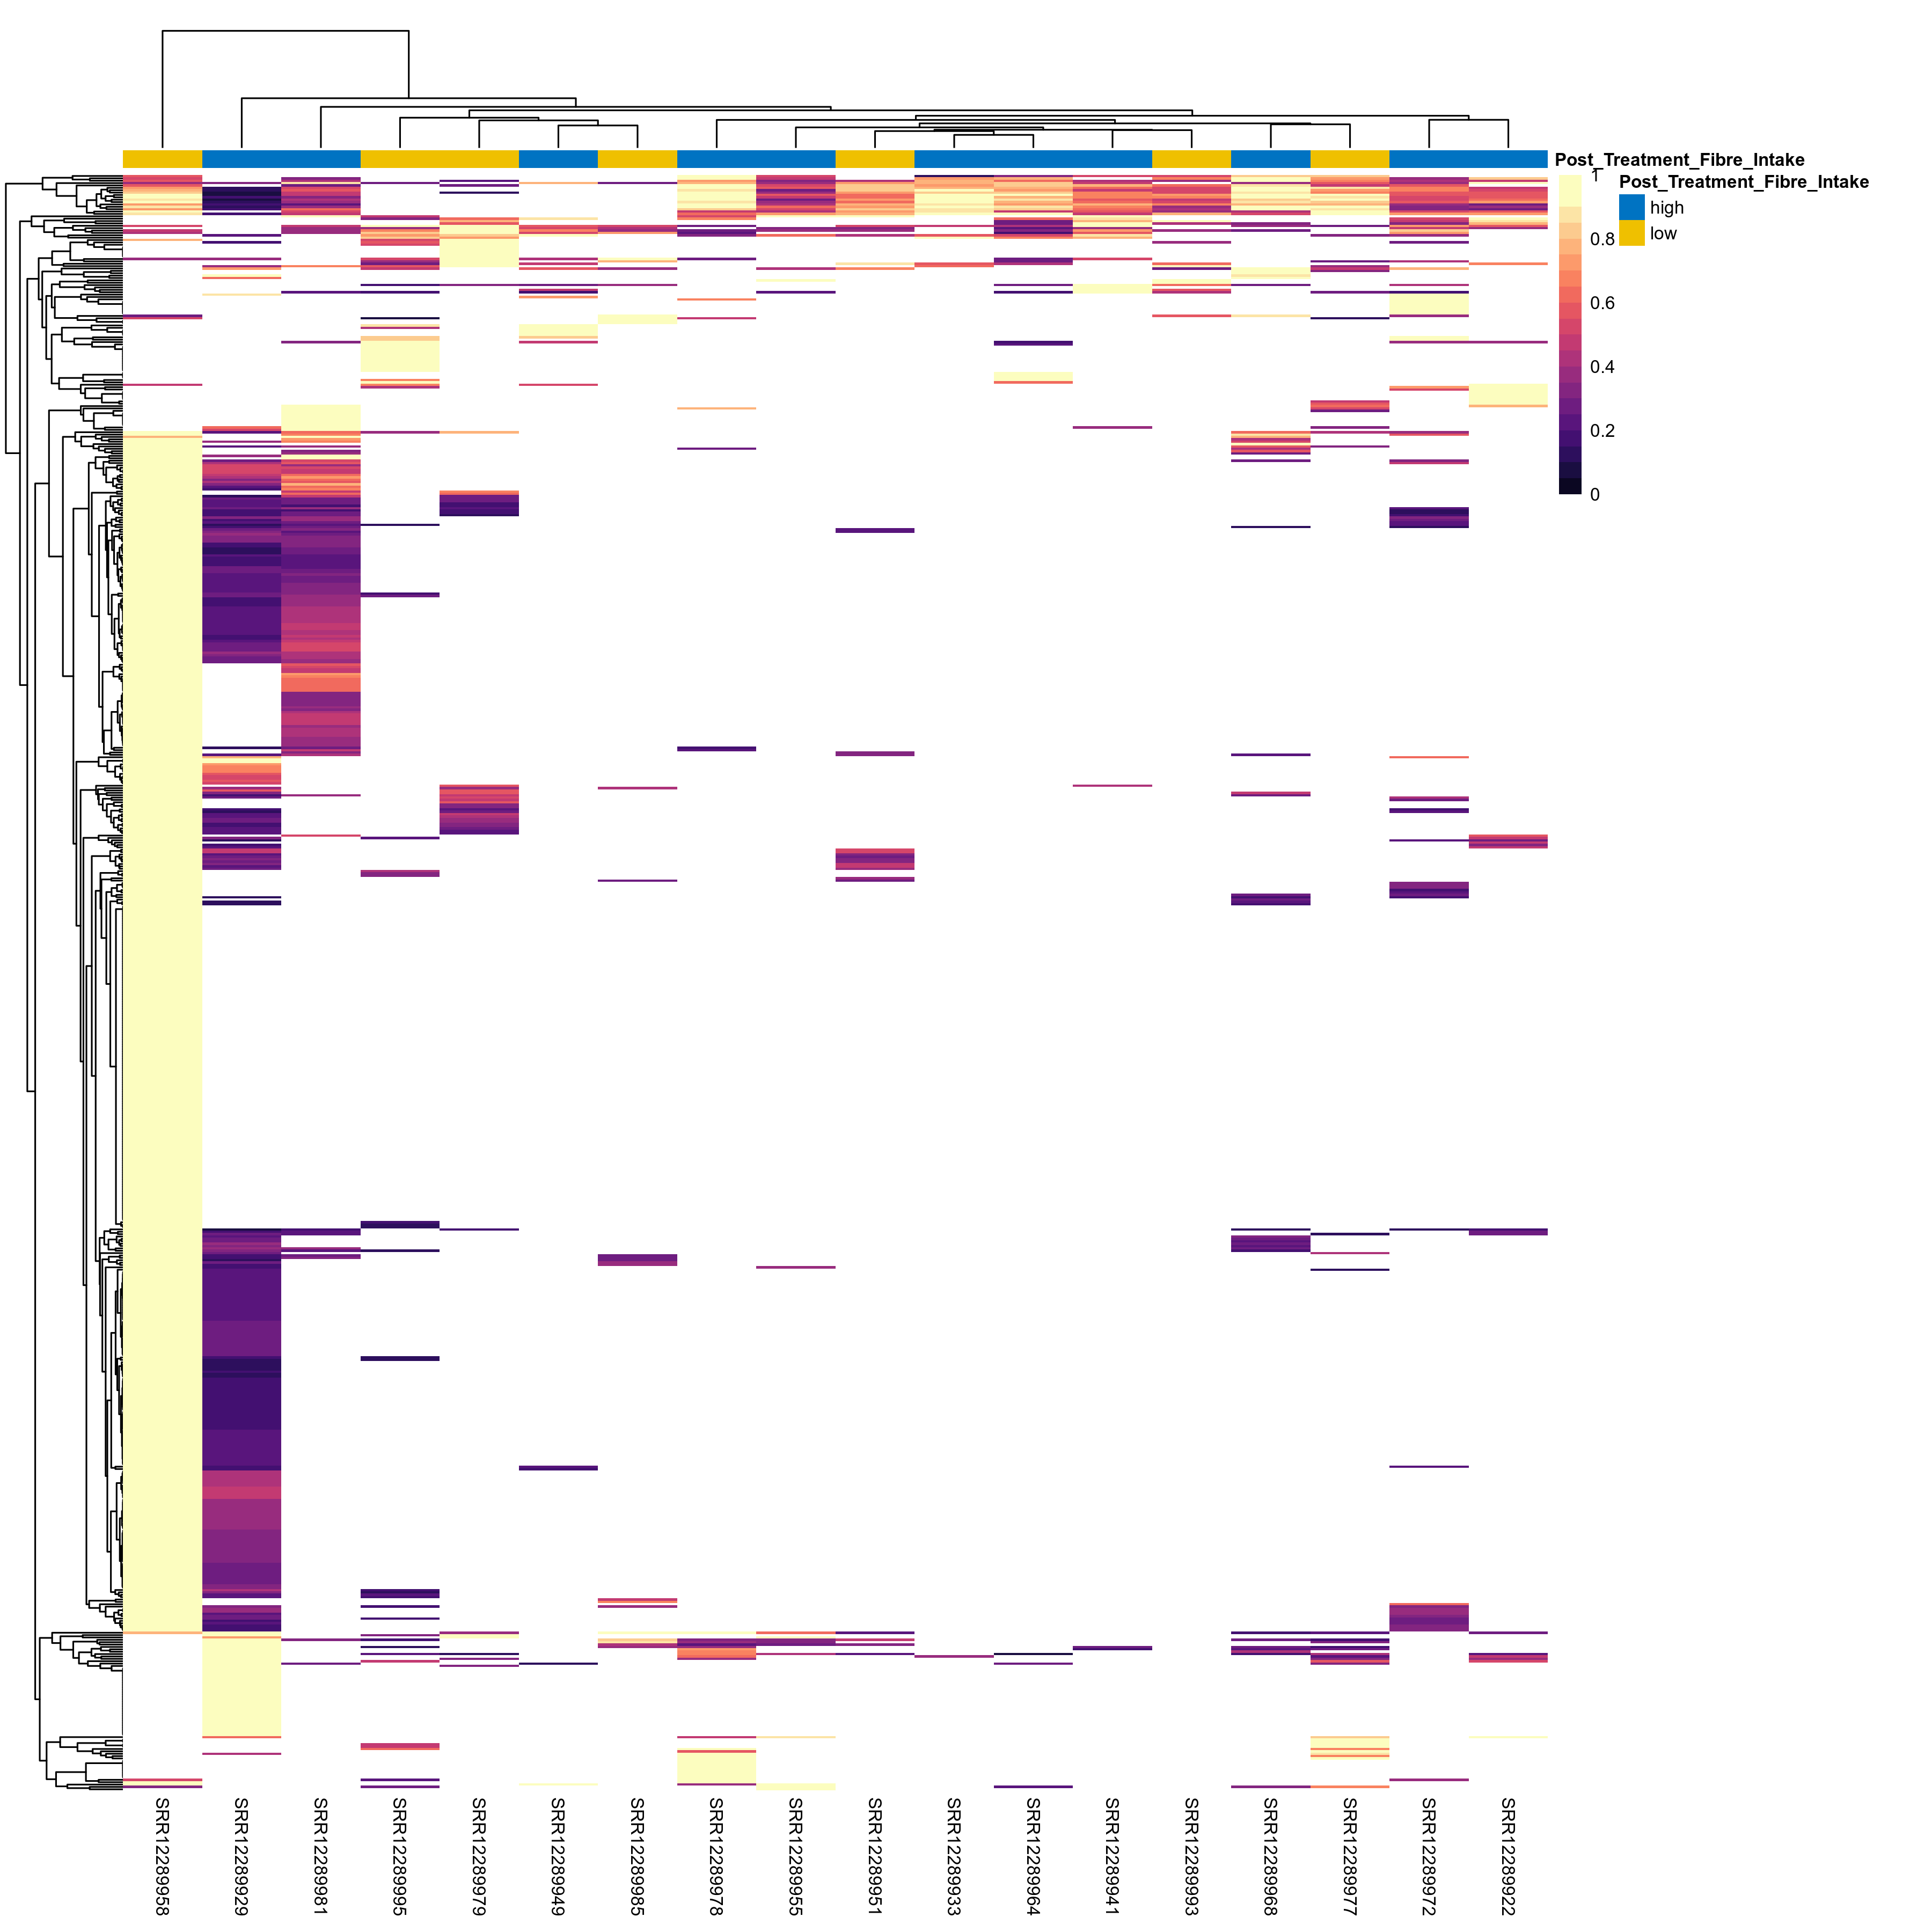
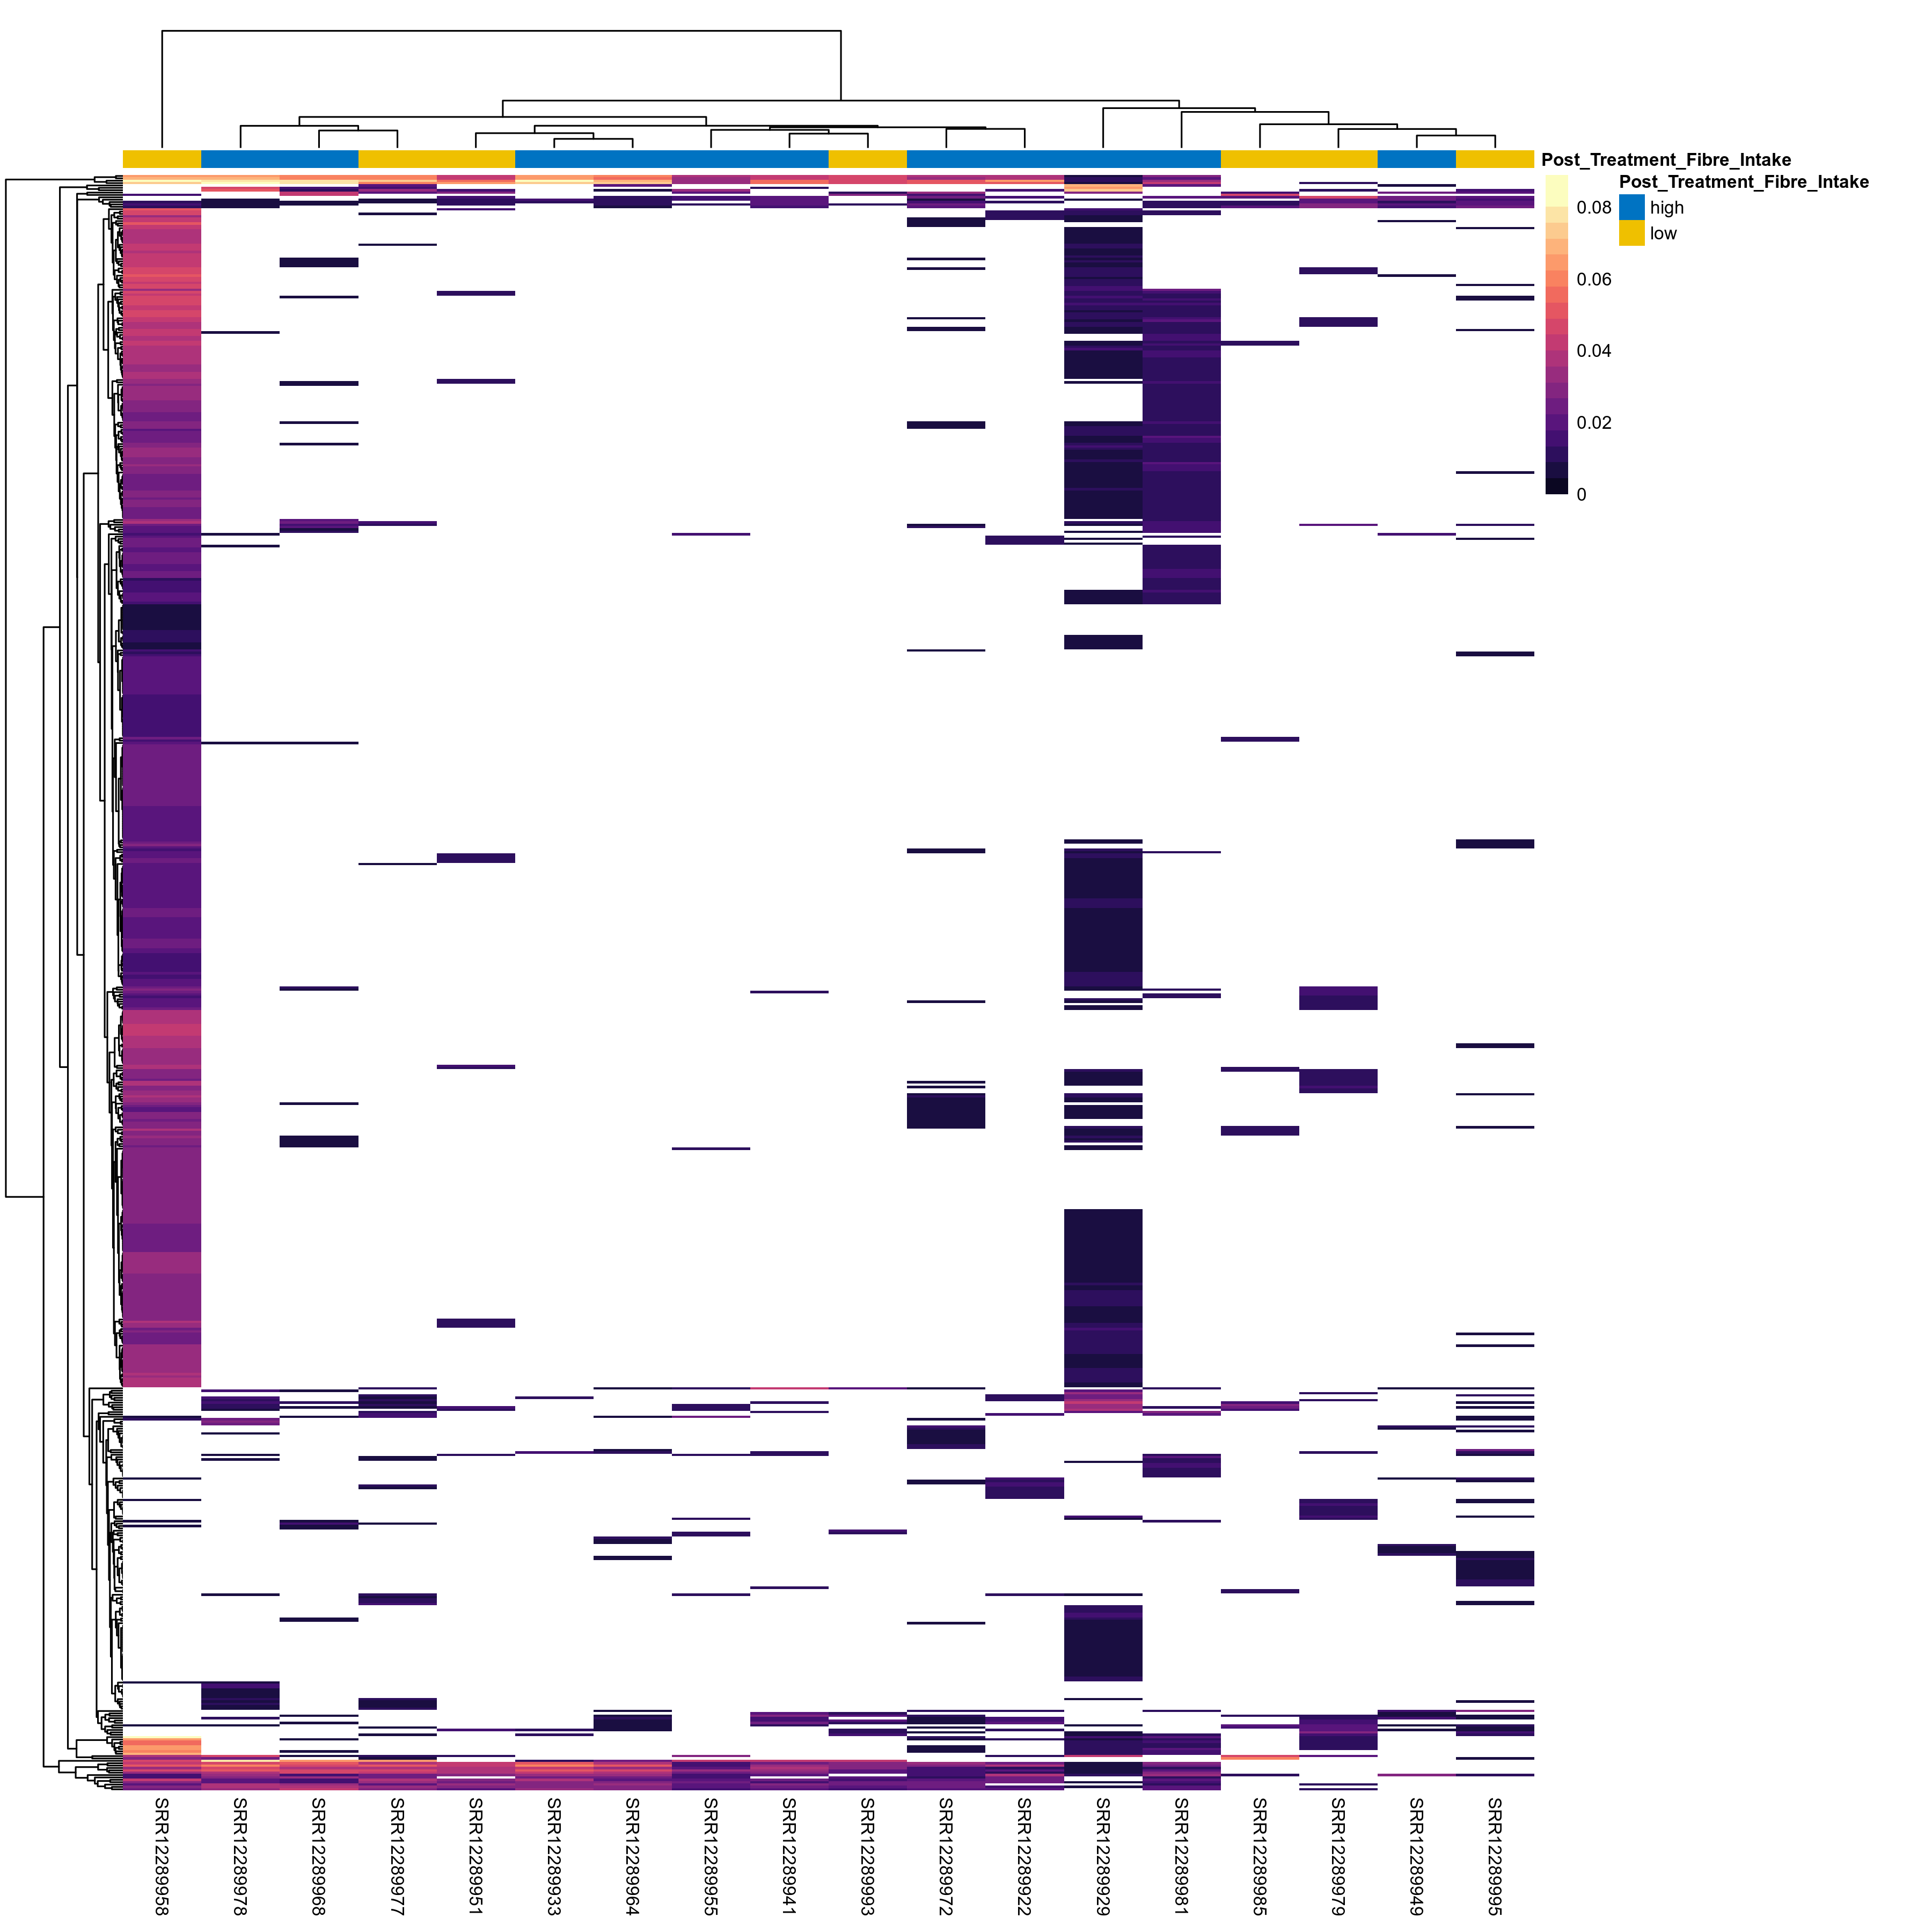
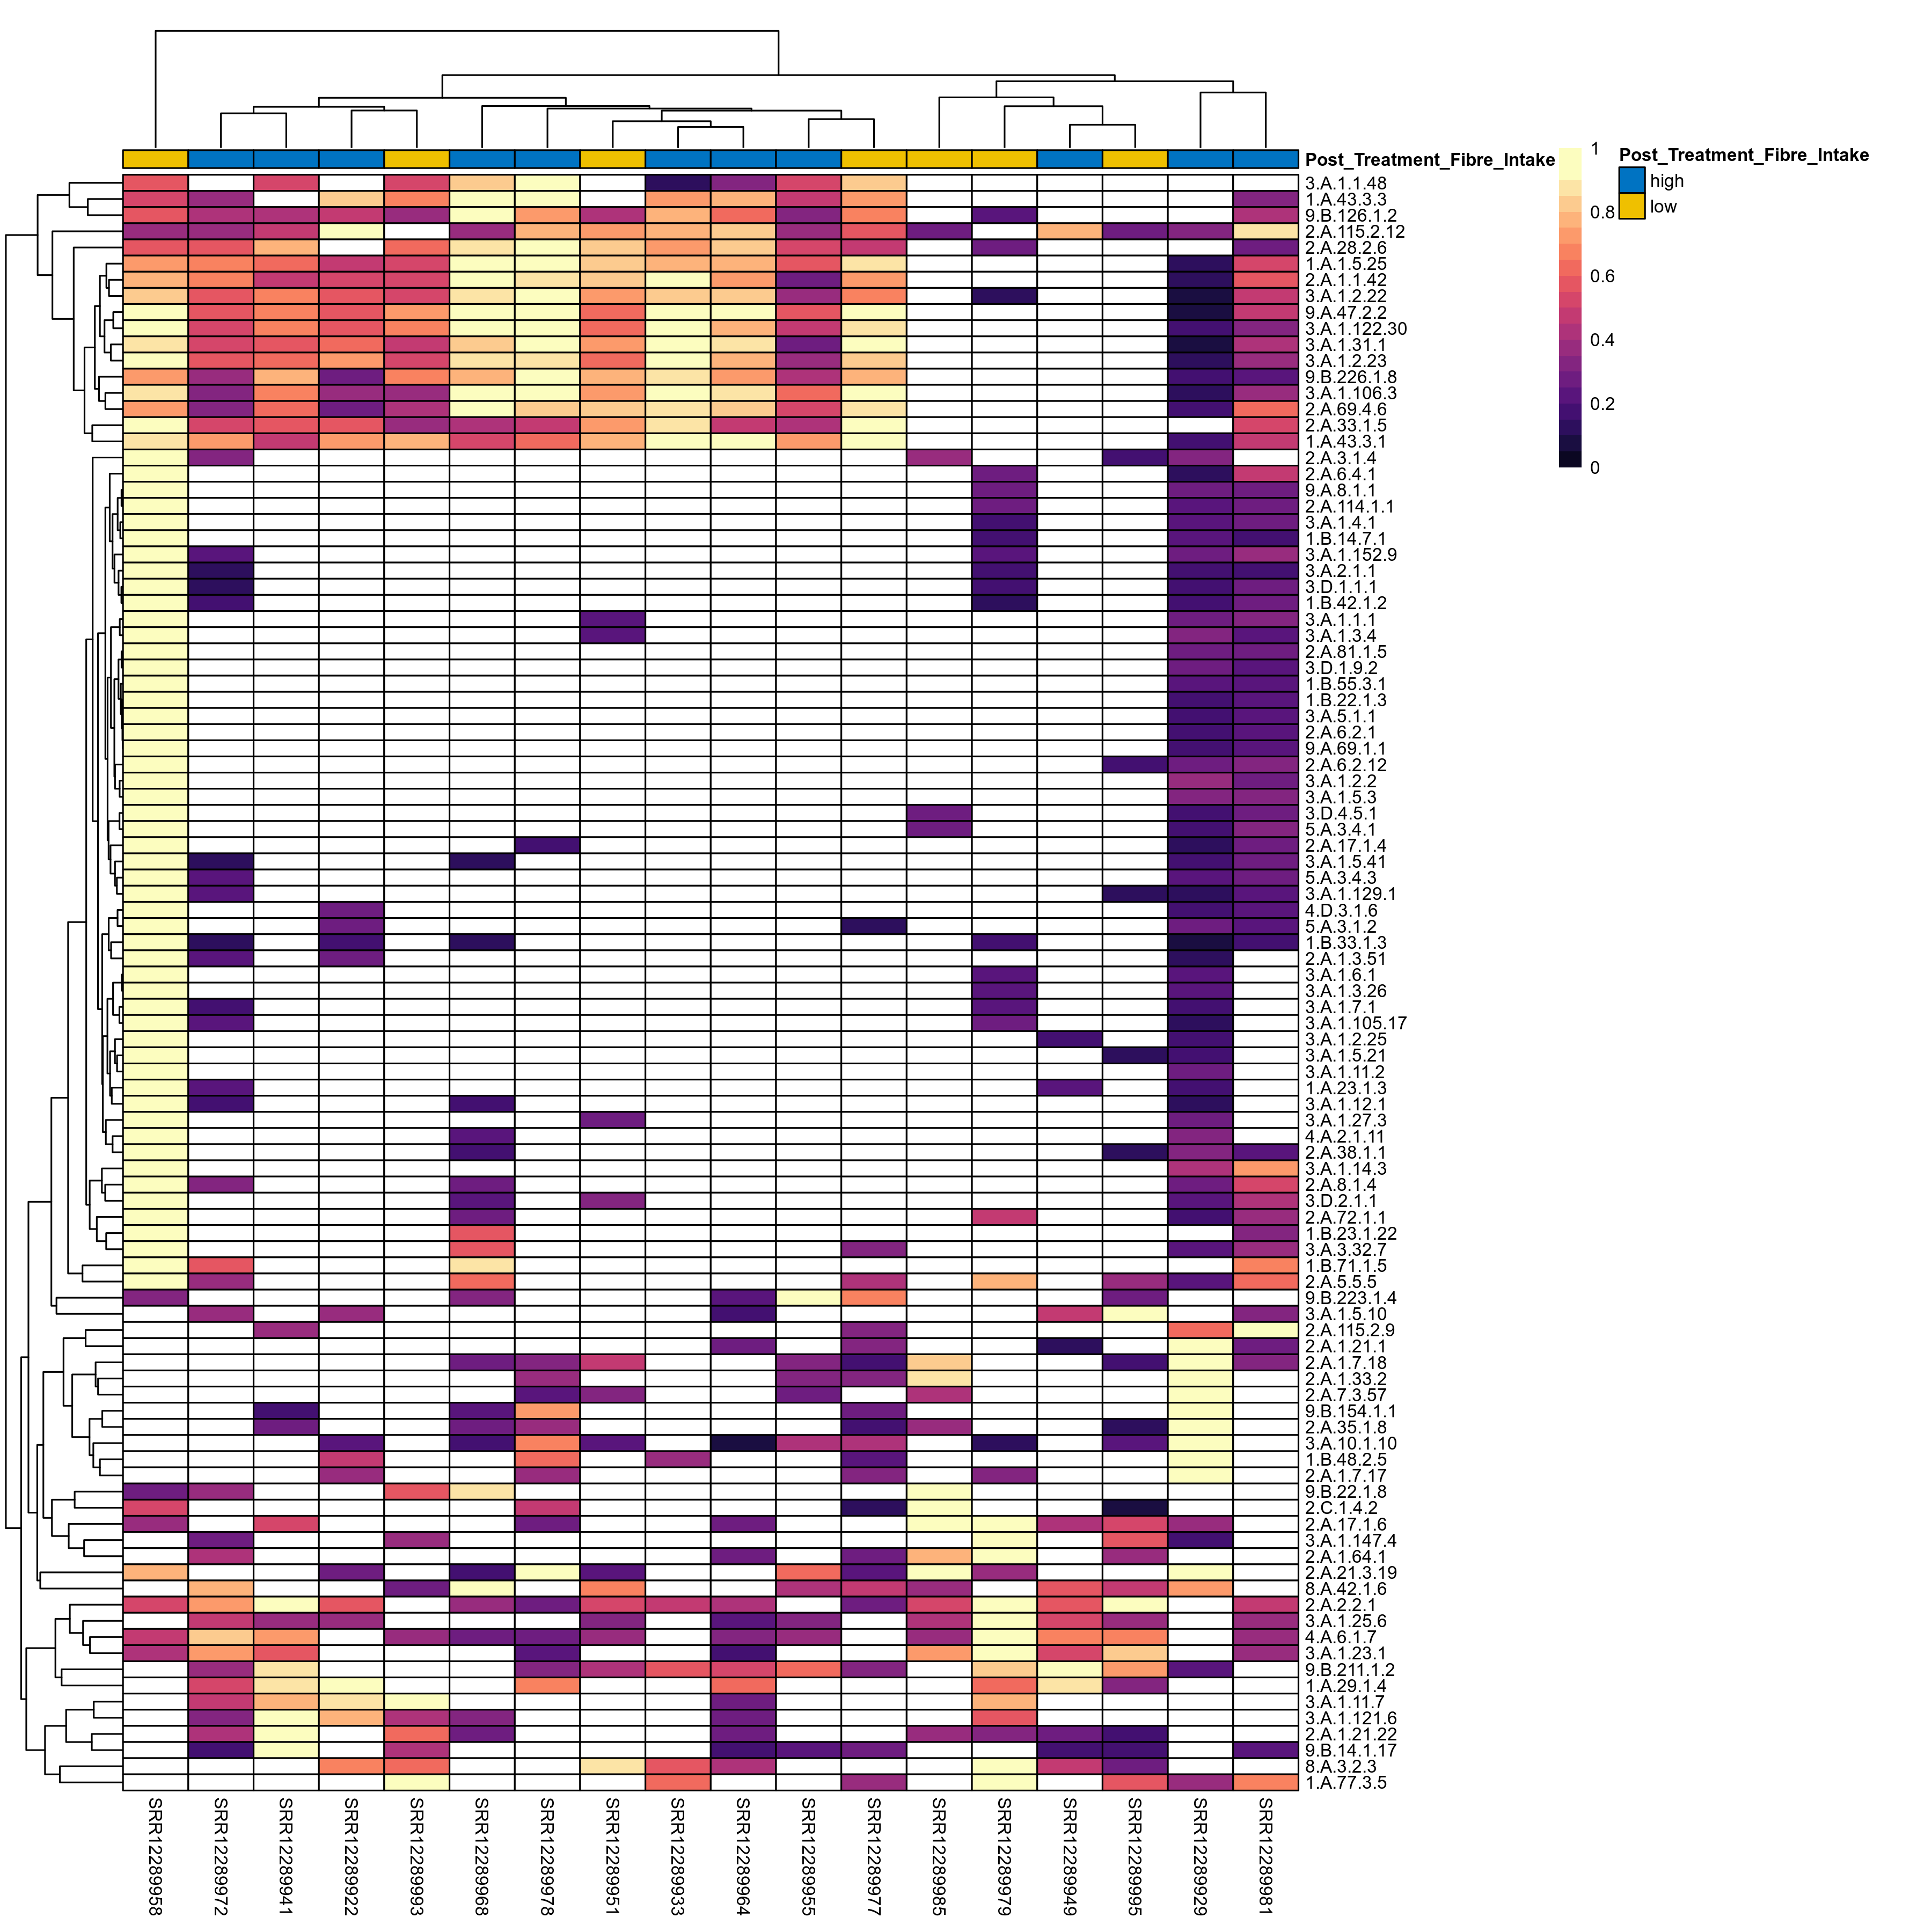
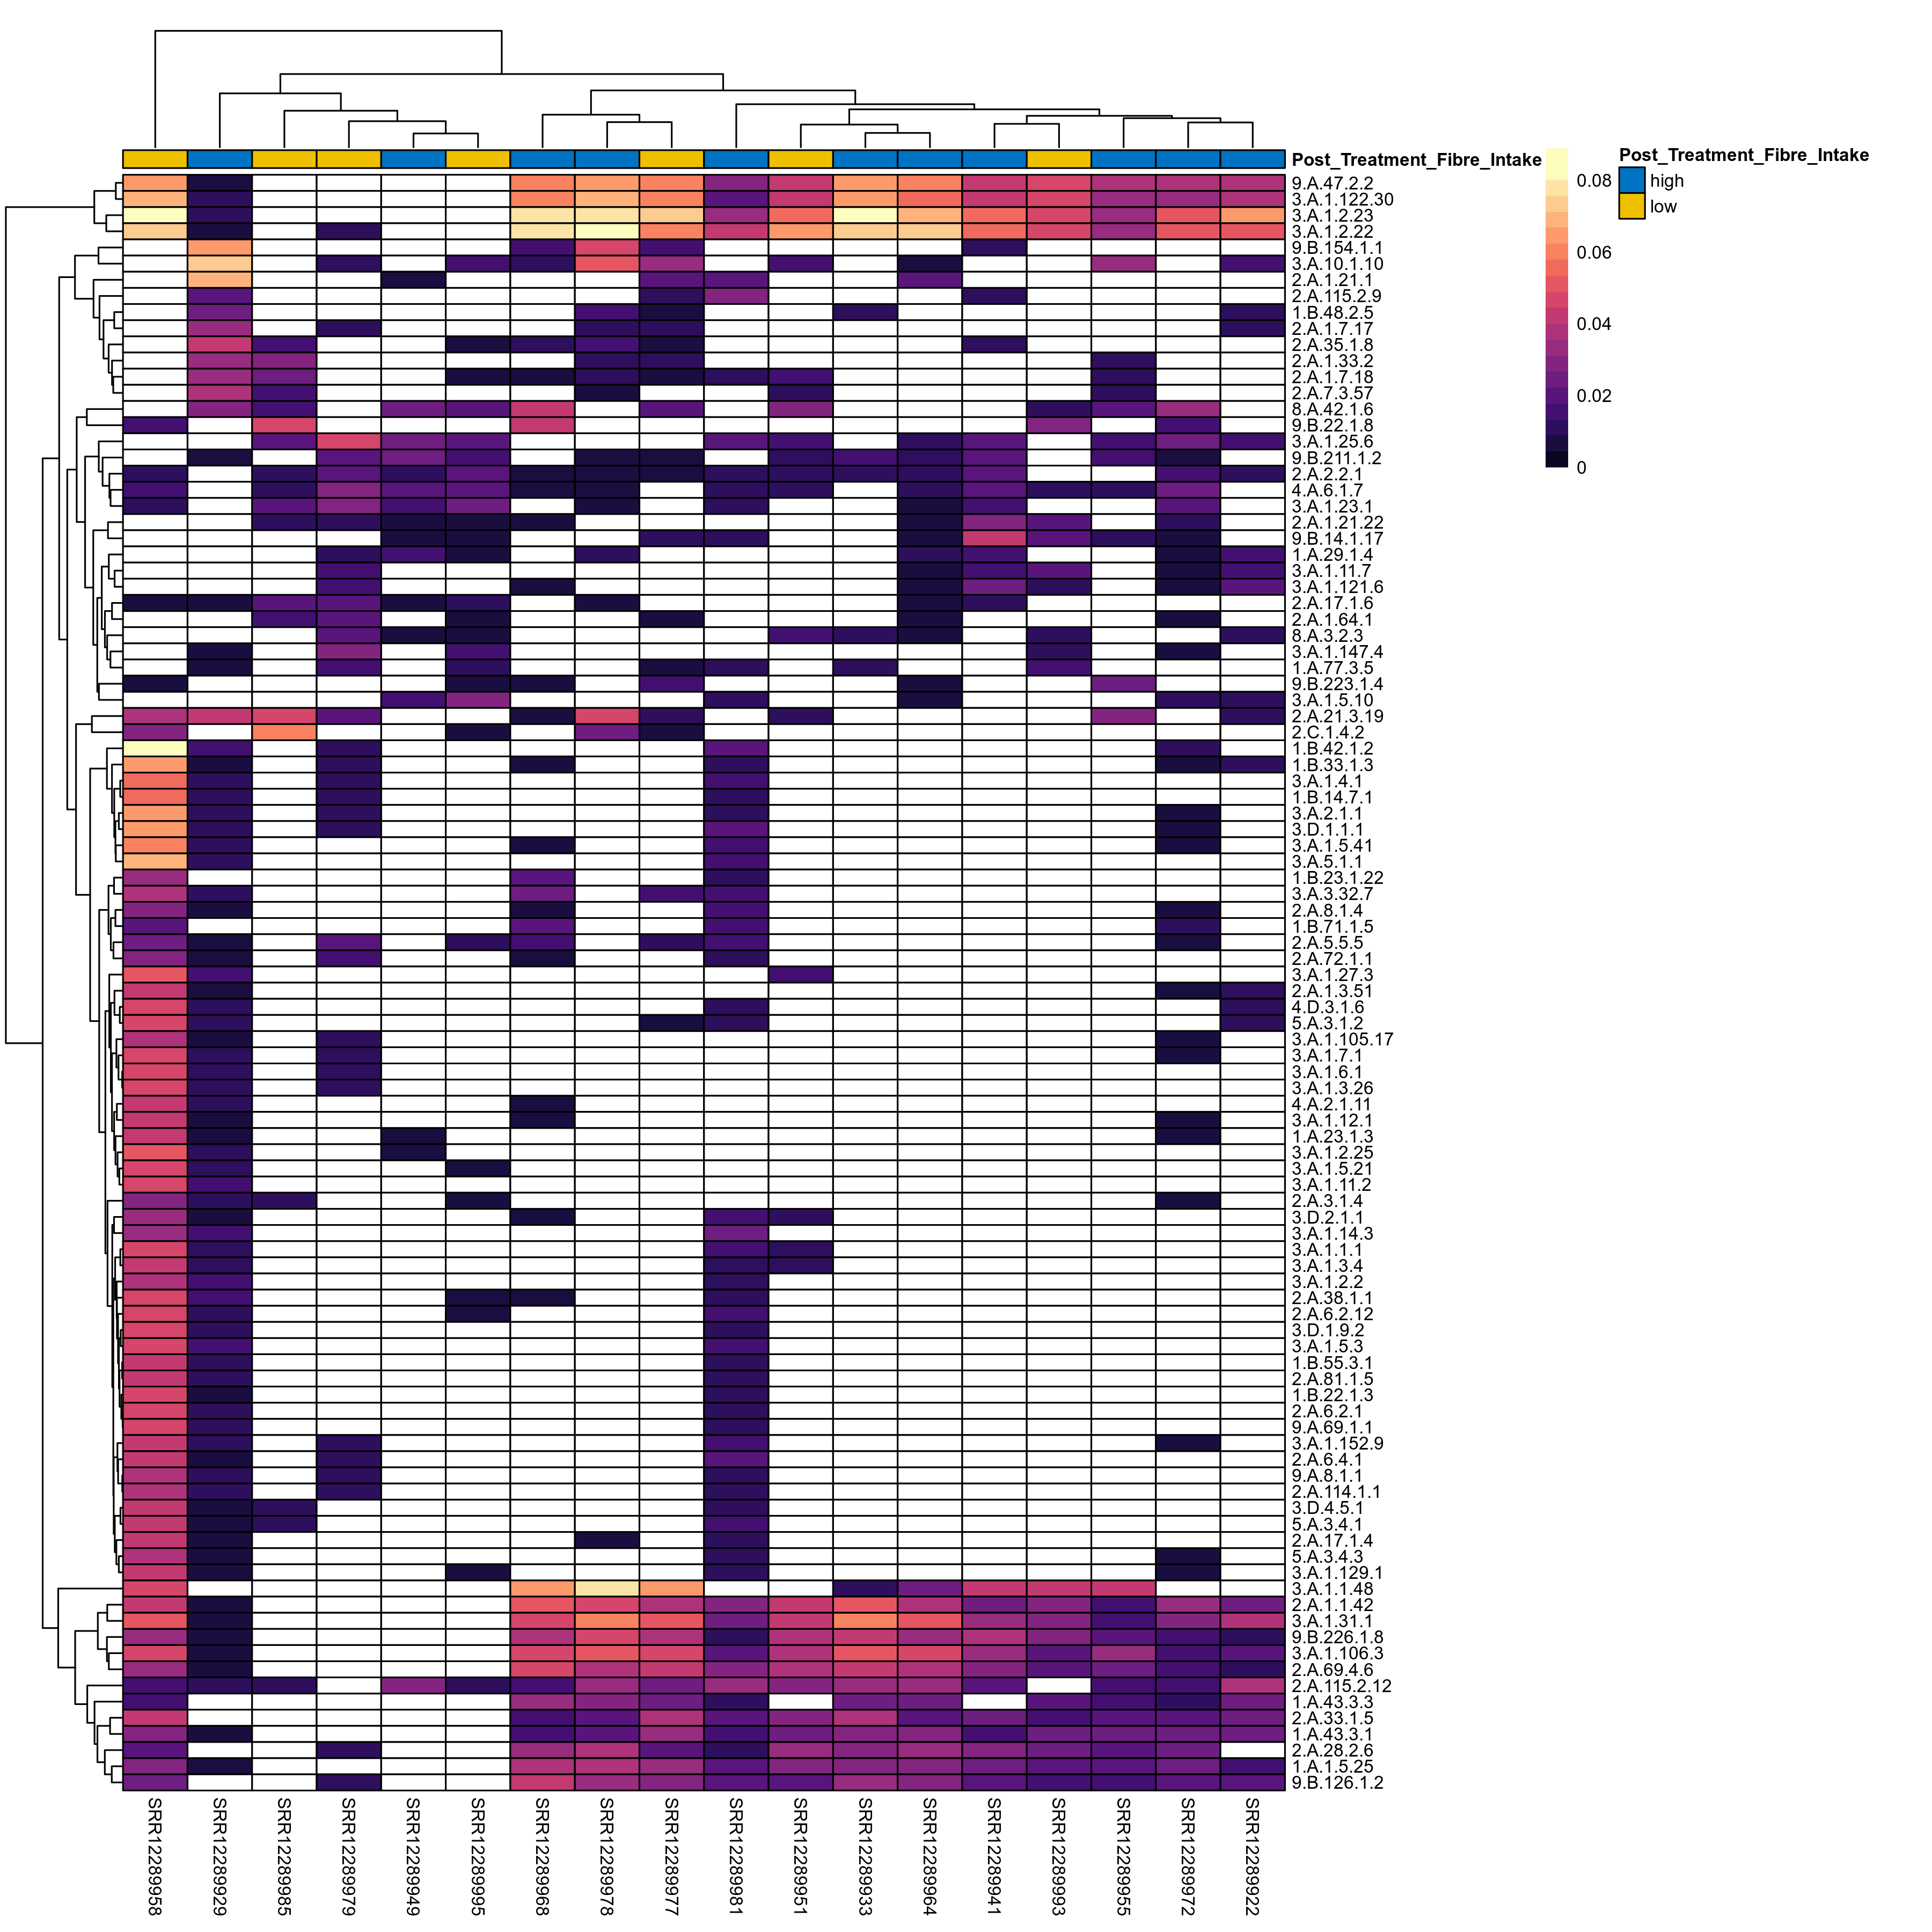
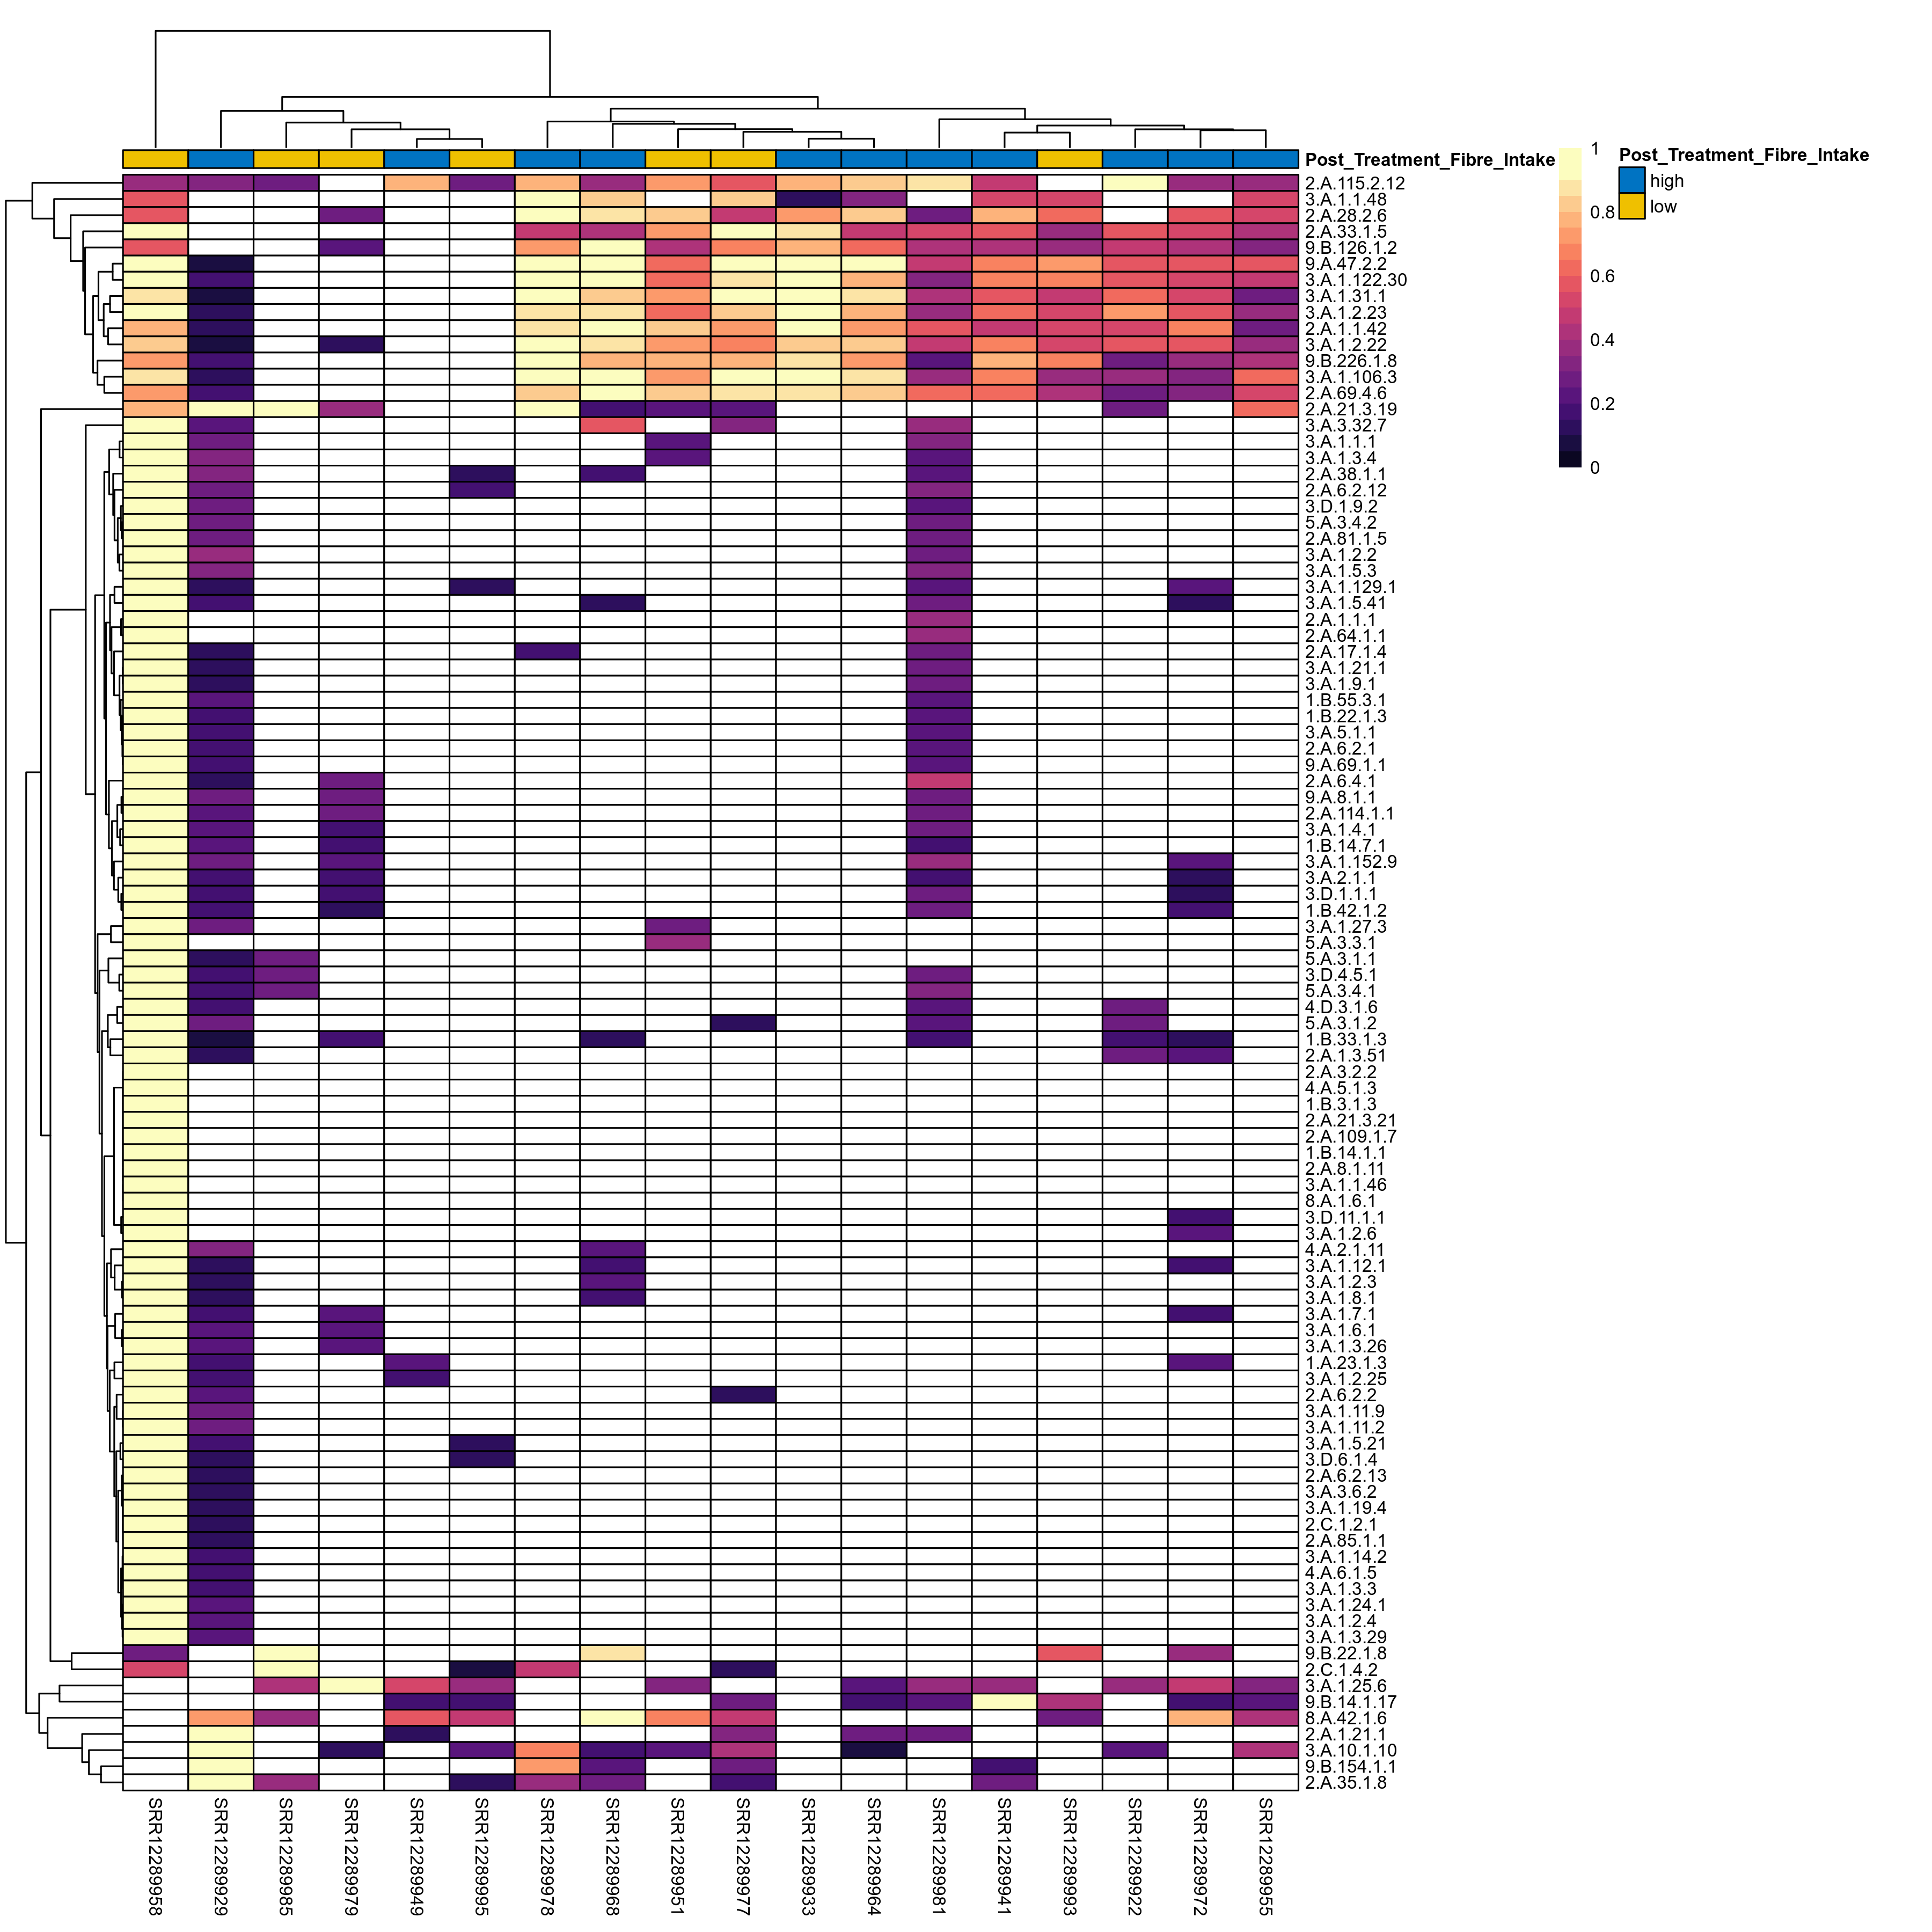
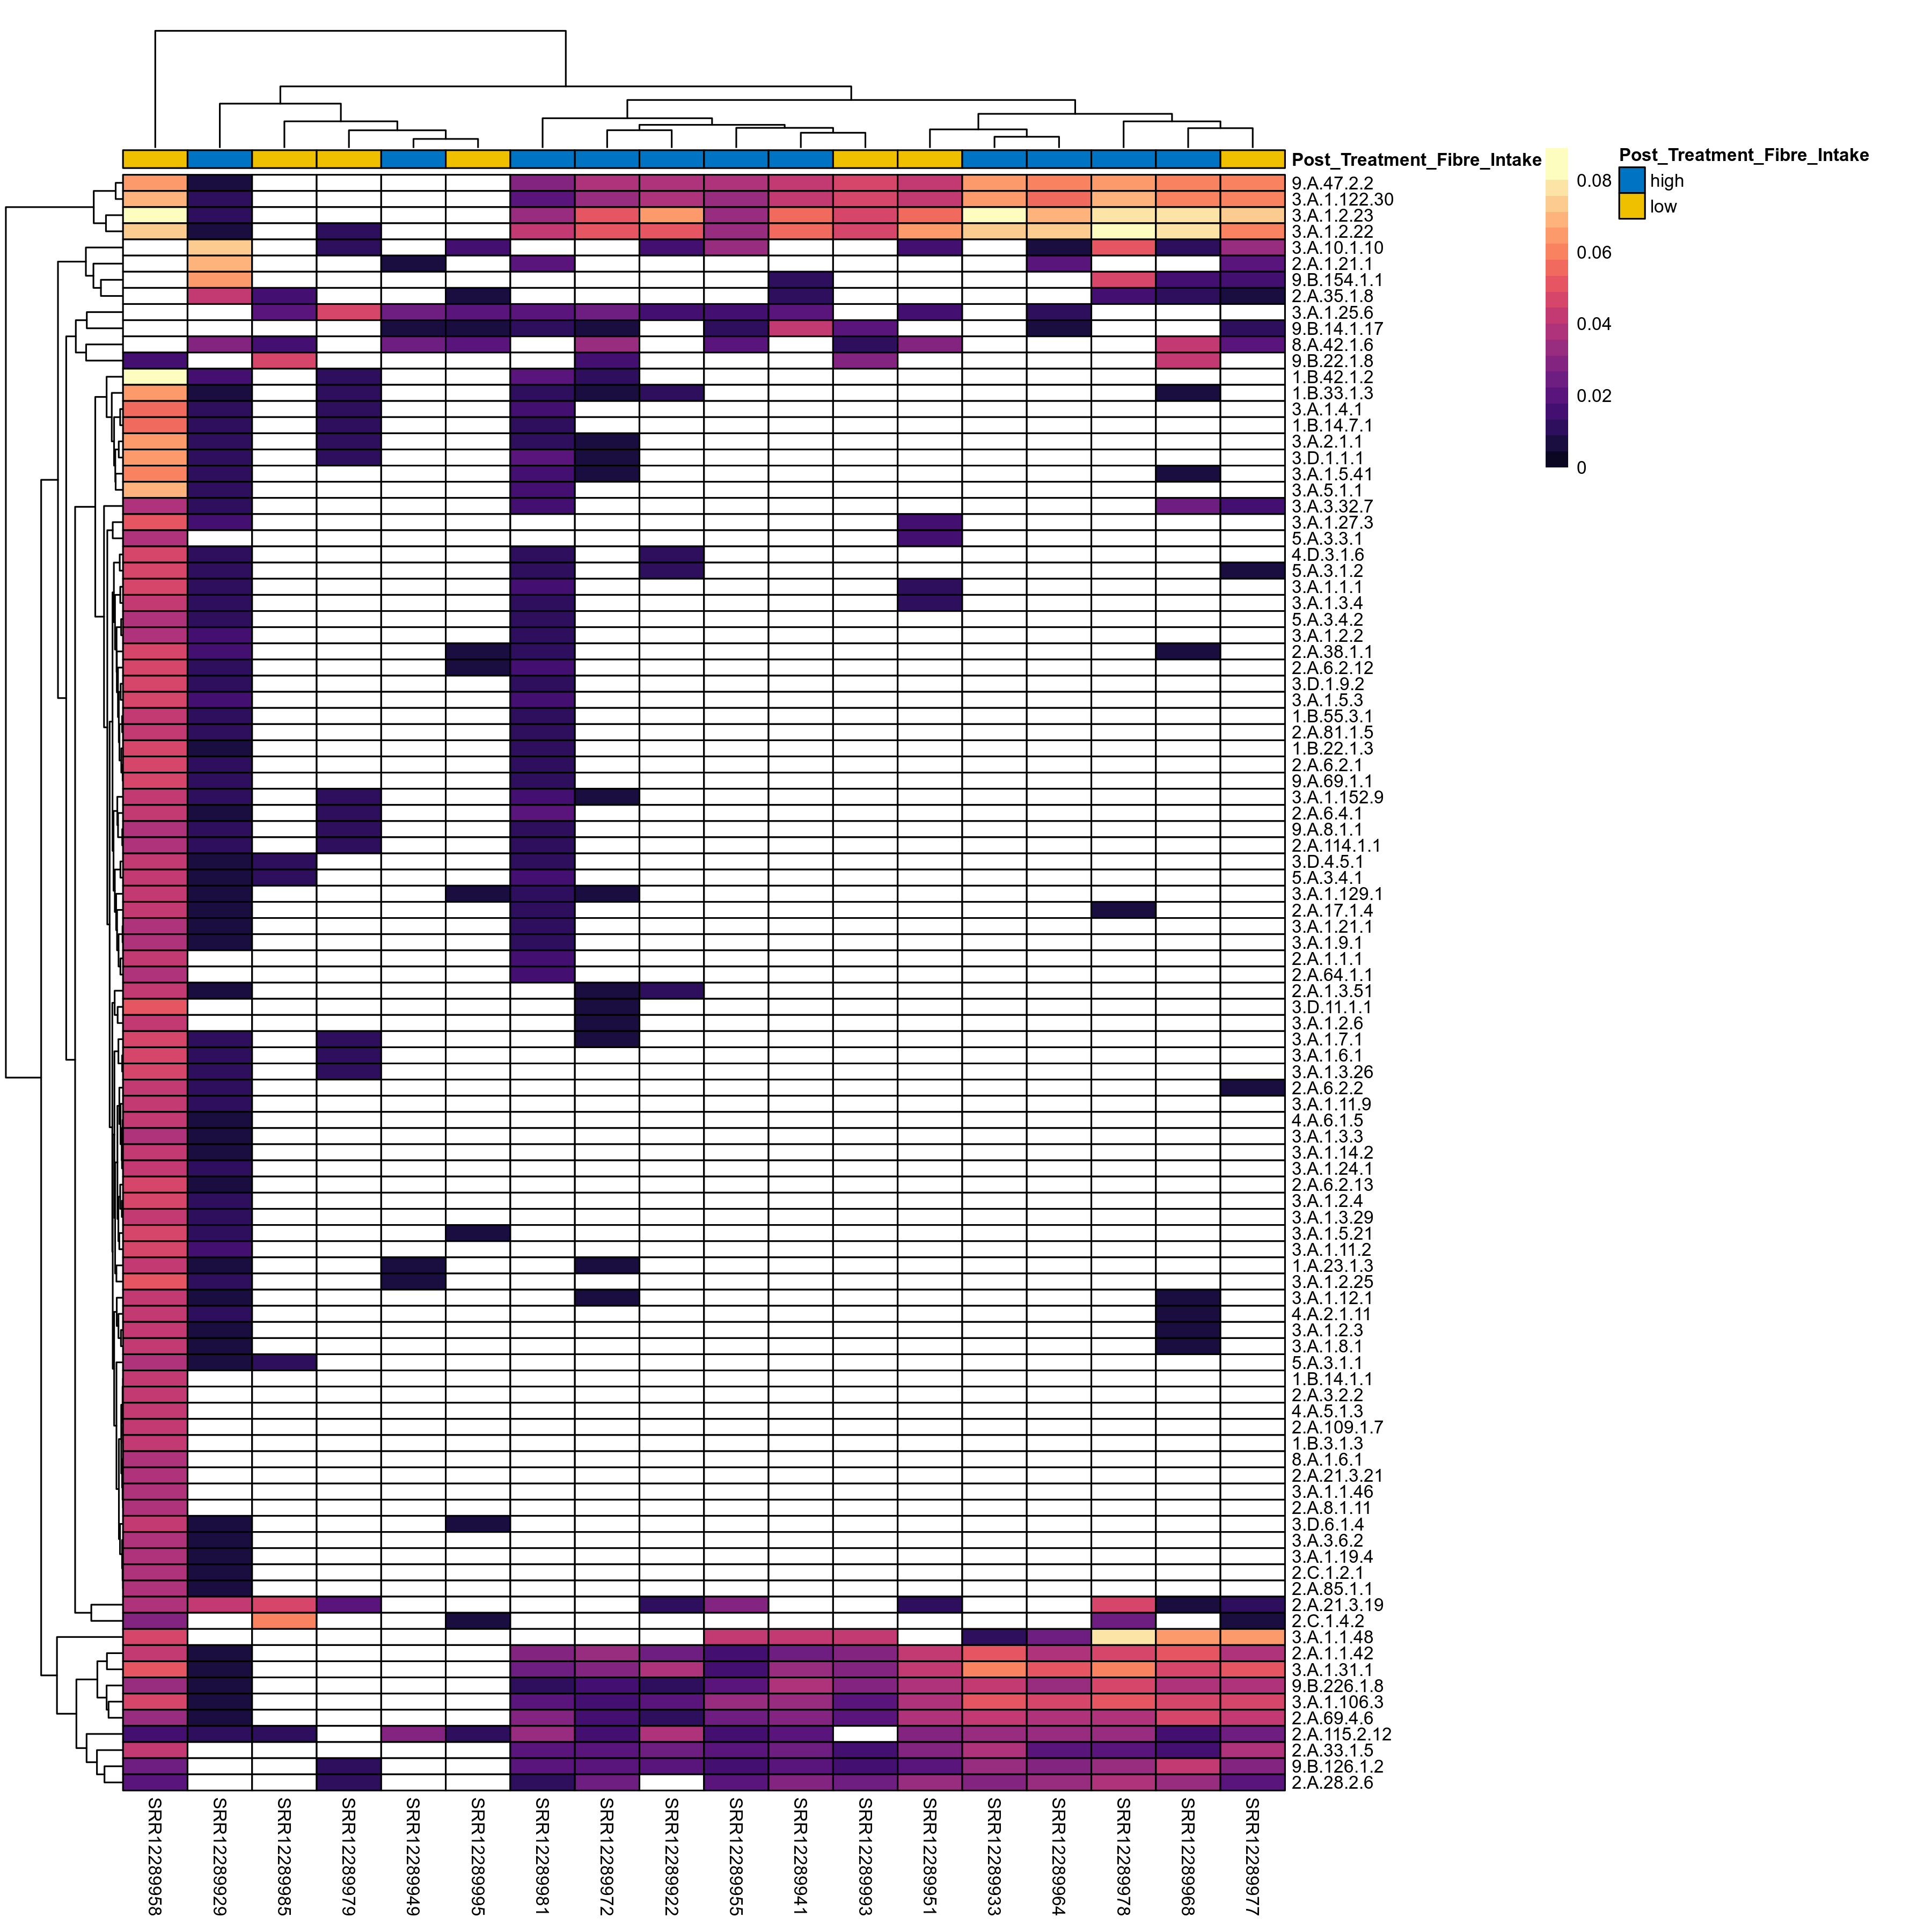
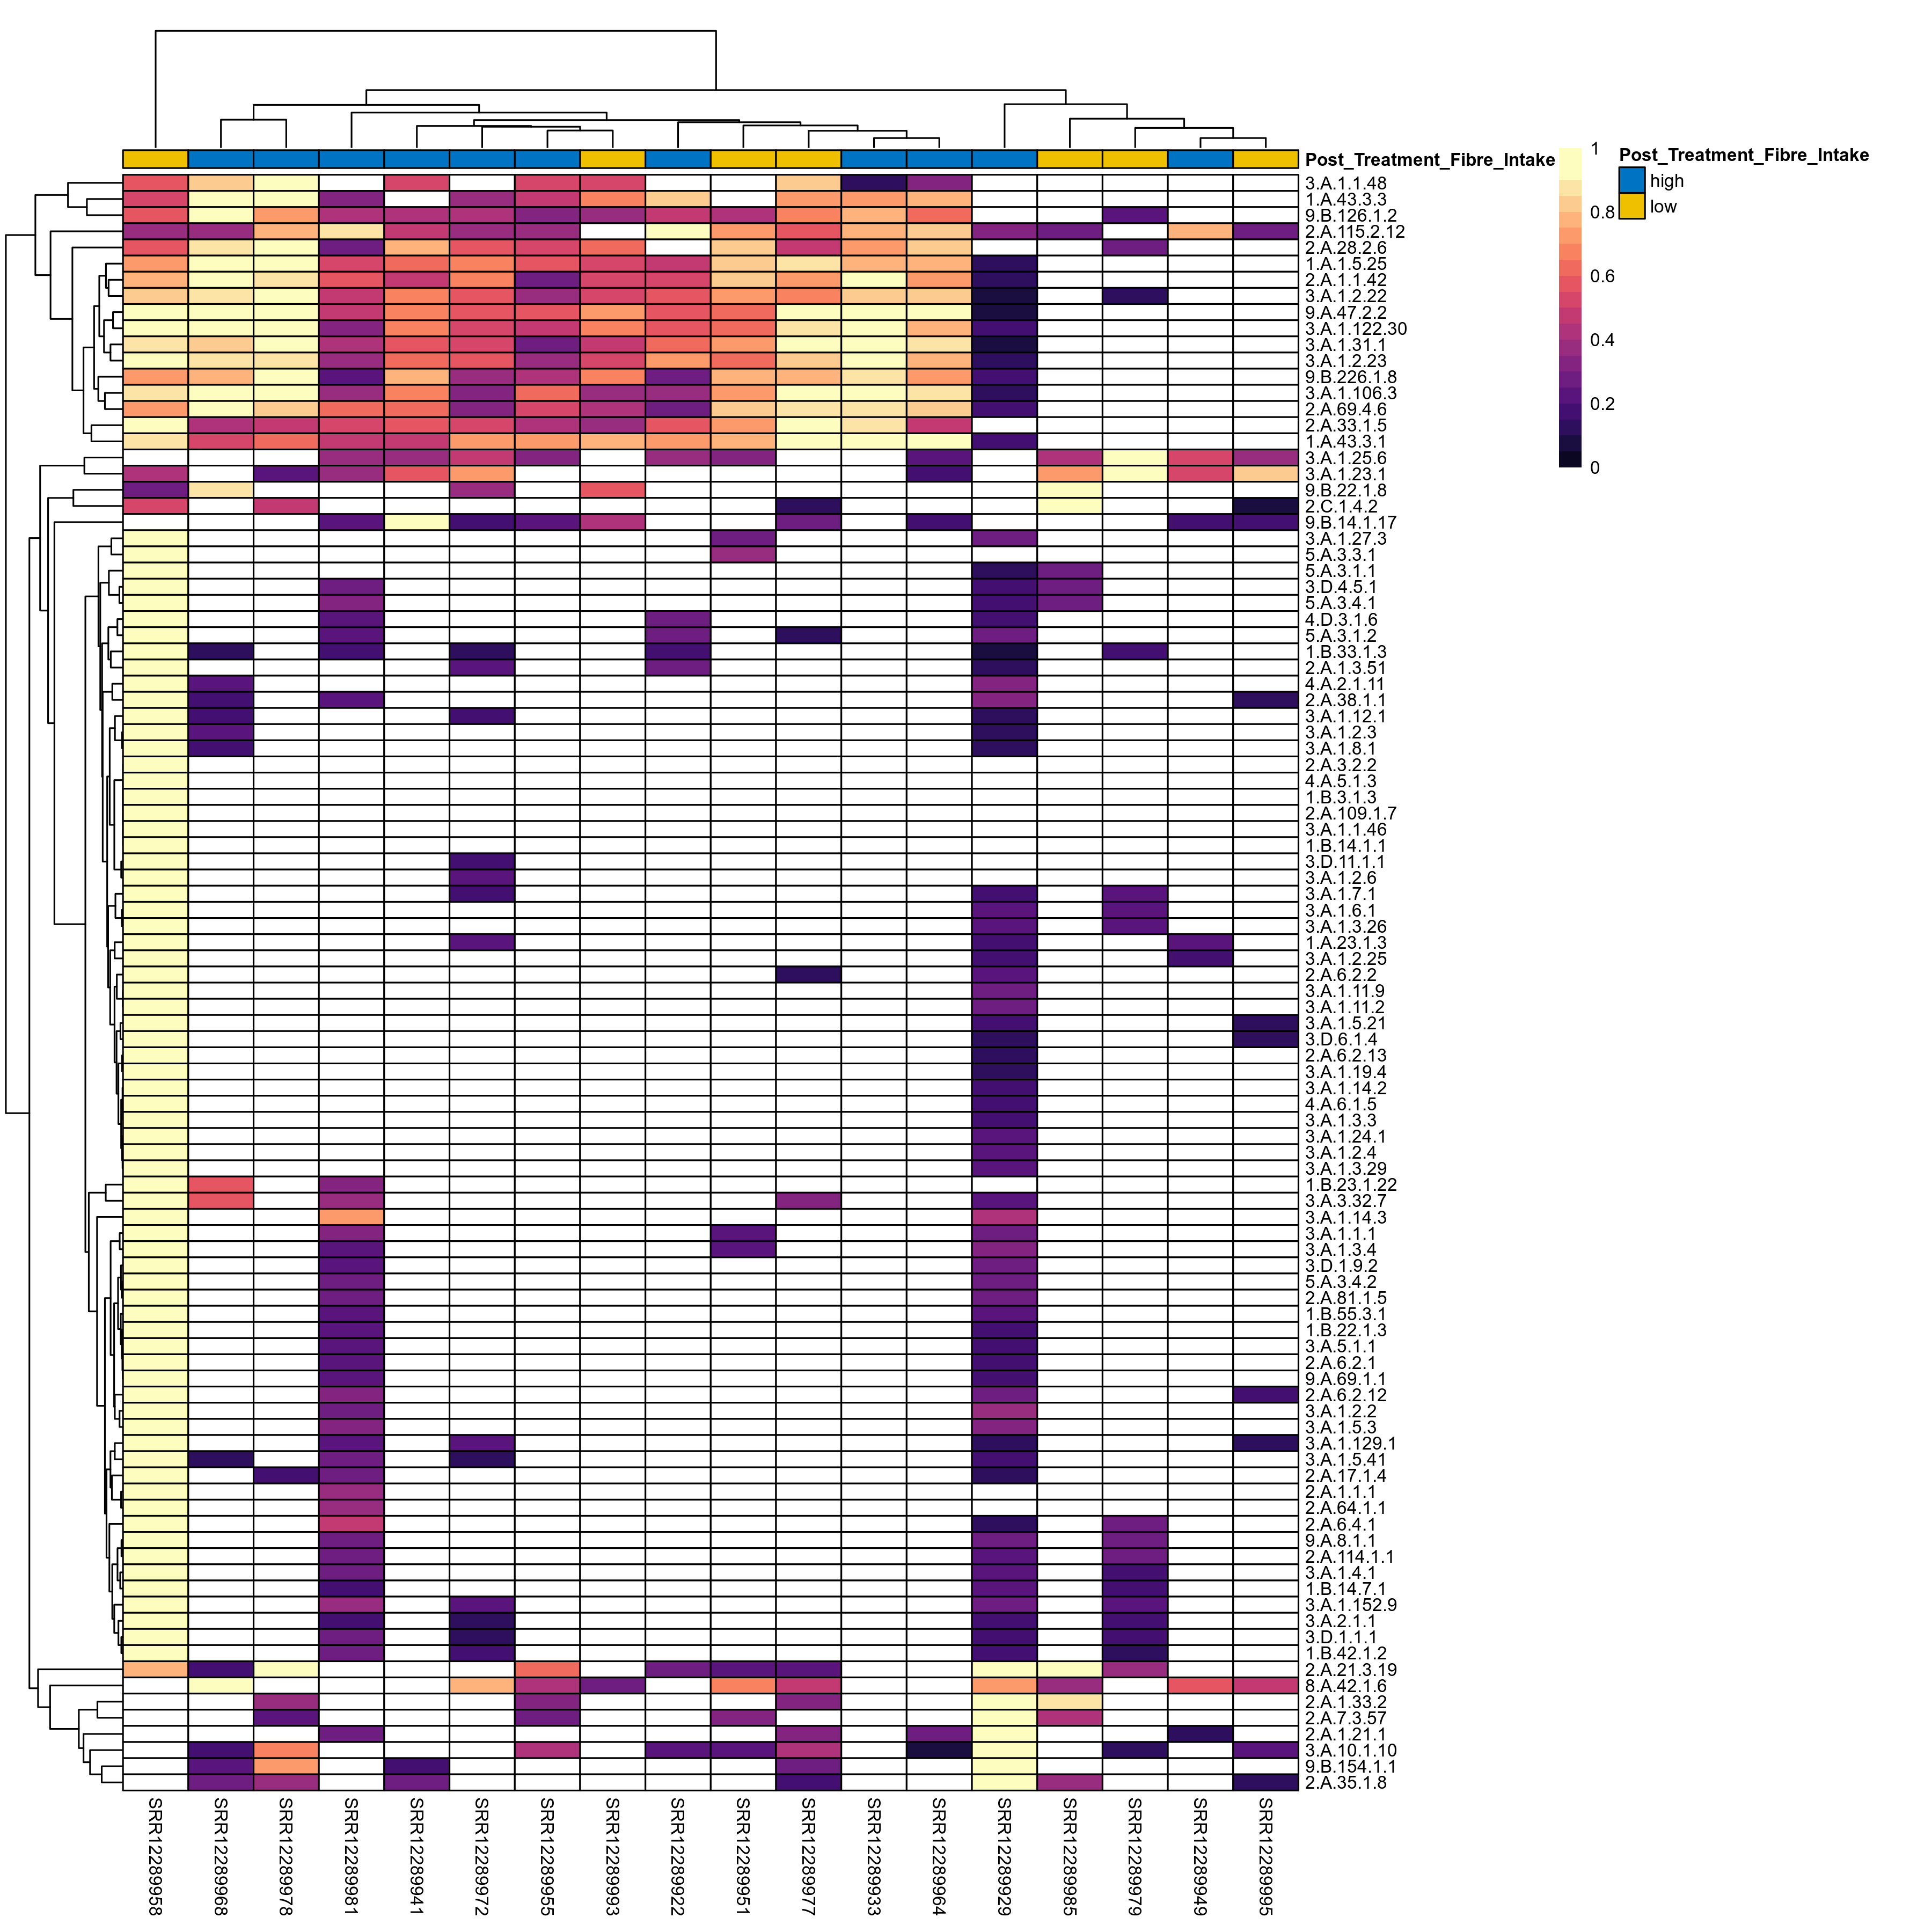
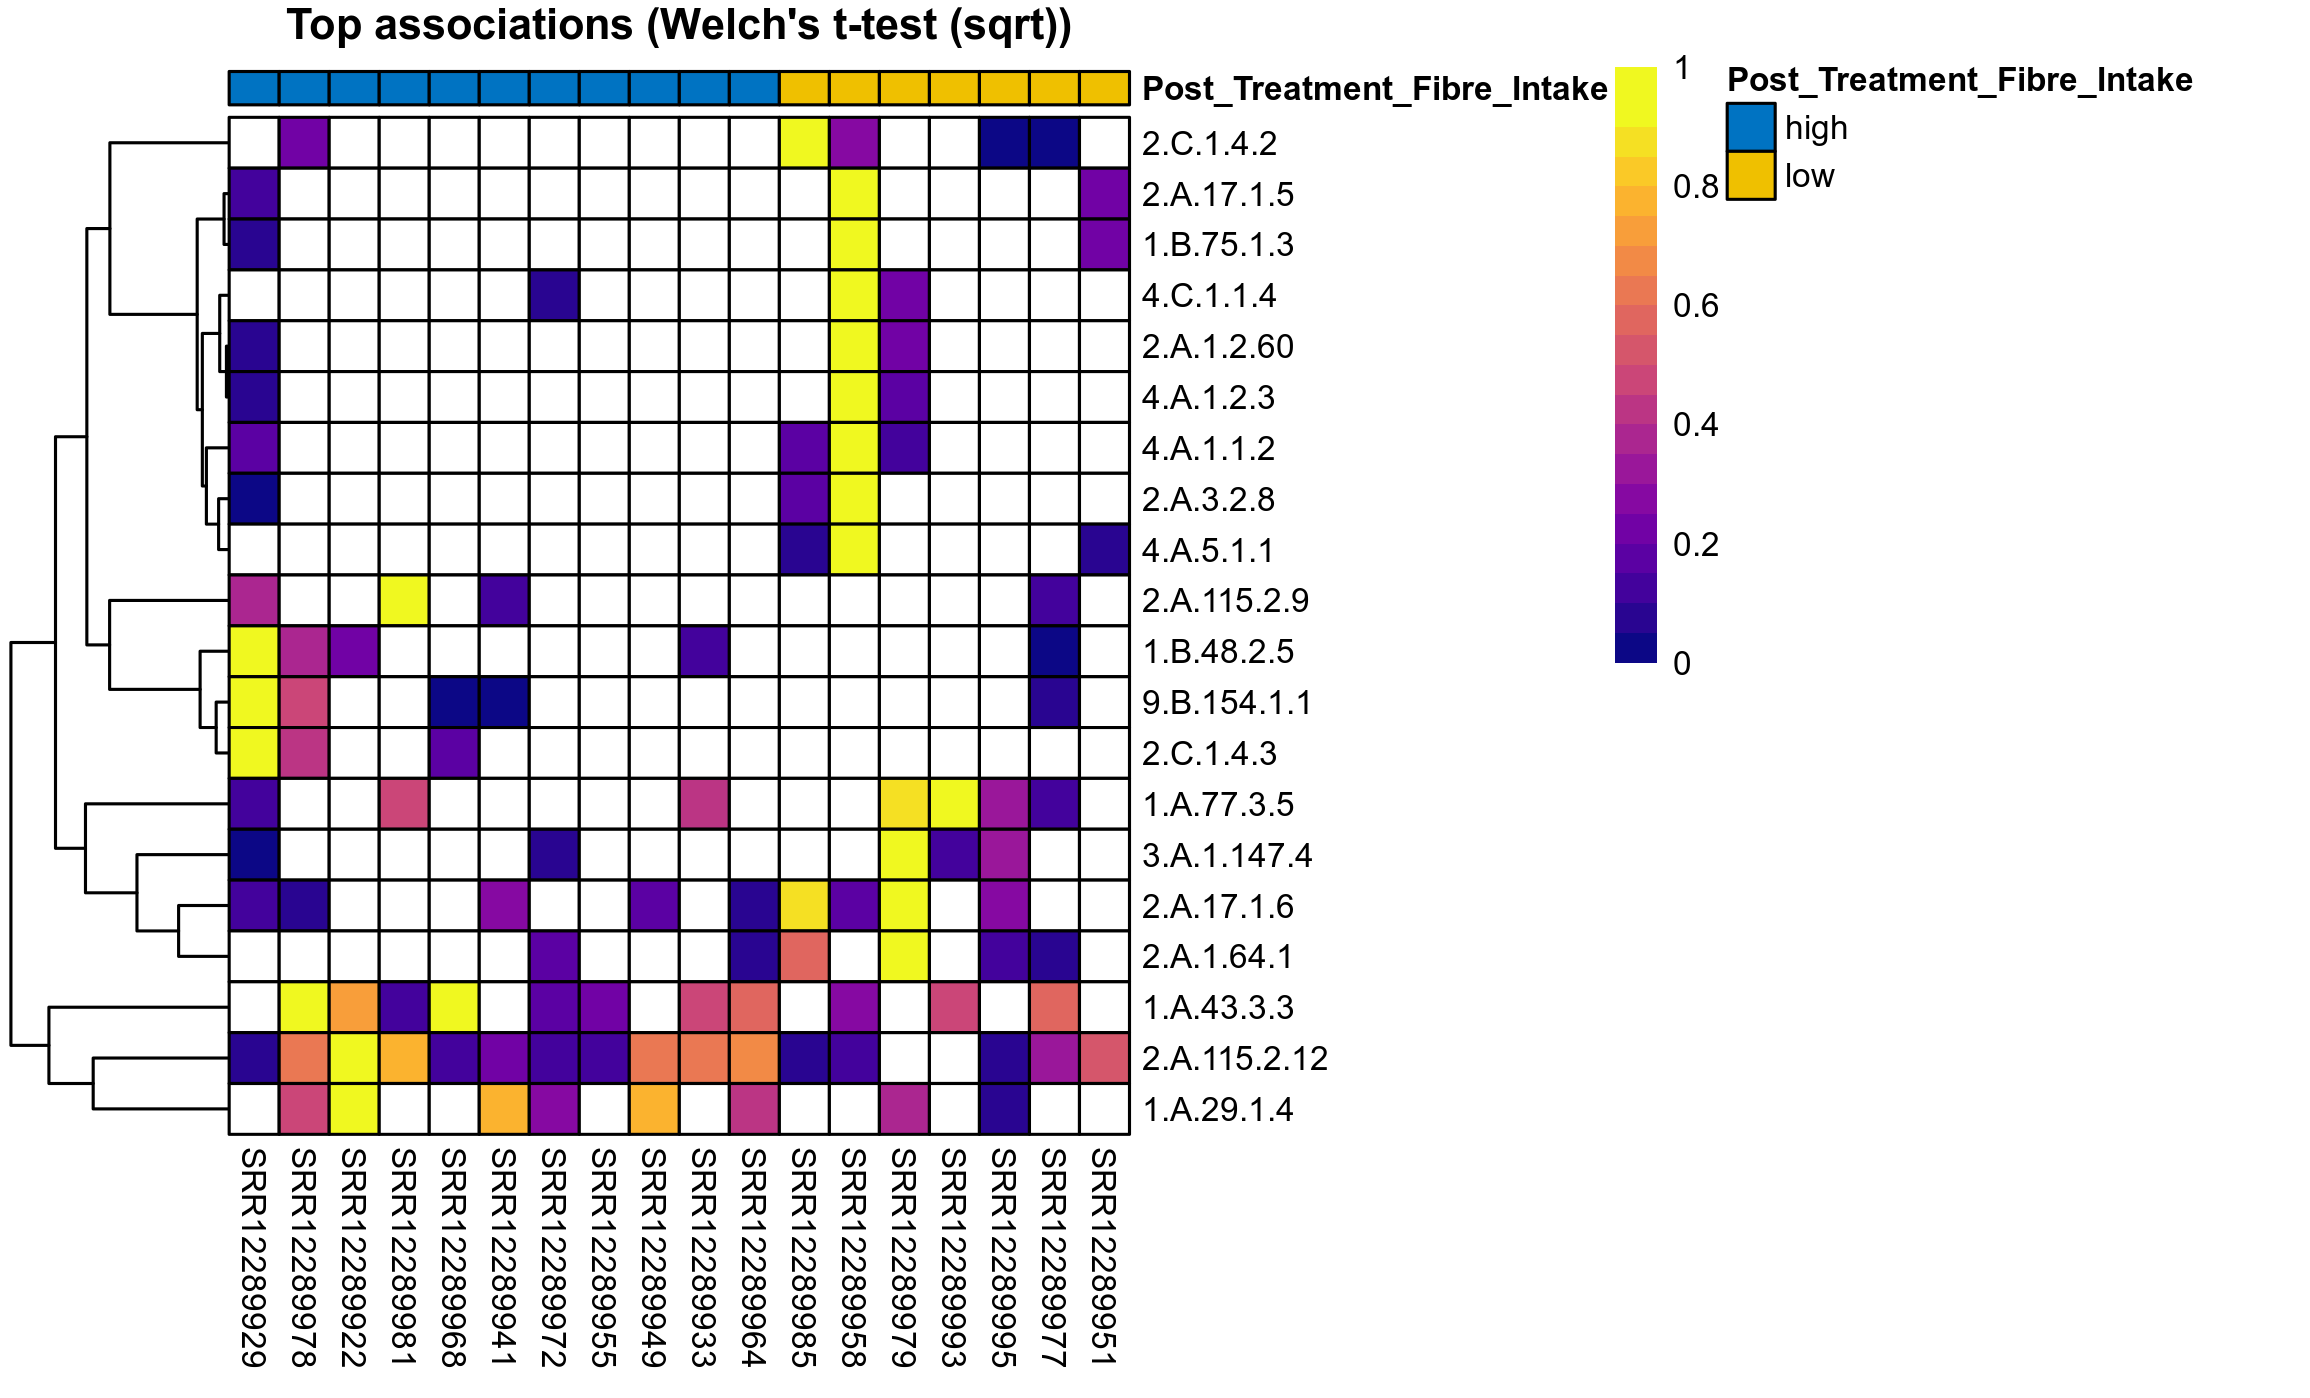
Quantitative visualisation of the top most abundant microbial functions identified in the analysed samples.
Click here to open full-sized image in new window.
Click here to open full-sized image in new window.
Click here to open full-sized image in new window.
Click here to open full-sized image in new window.
Click here to open full-sized image in new window.
Click here to open full-sized image in new window.
Click here to open full-sized image in new window.
Click here to open full-sized image in new window.
Click here to open full-sized image in new window.
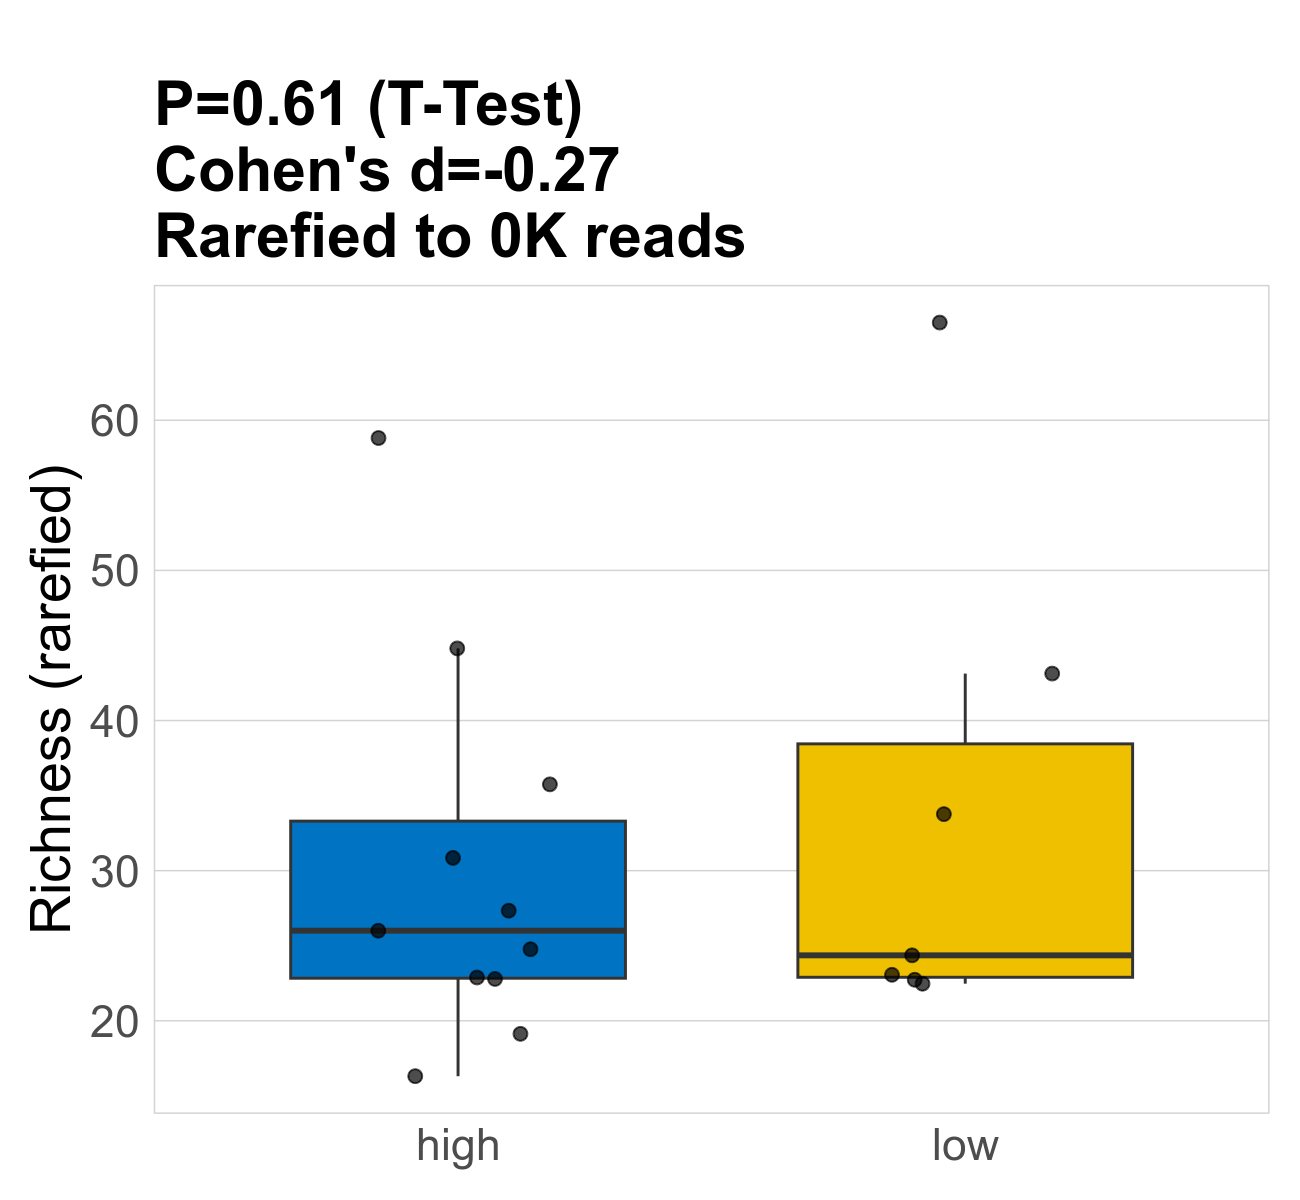
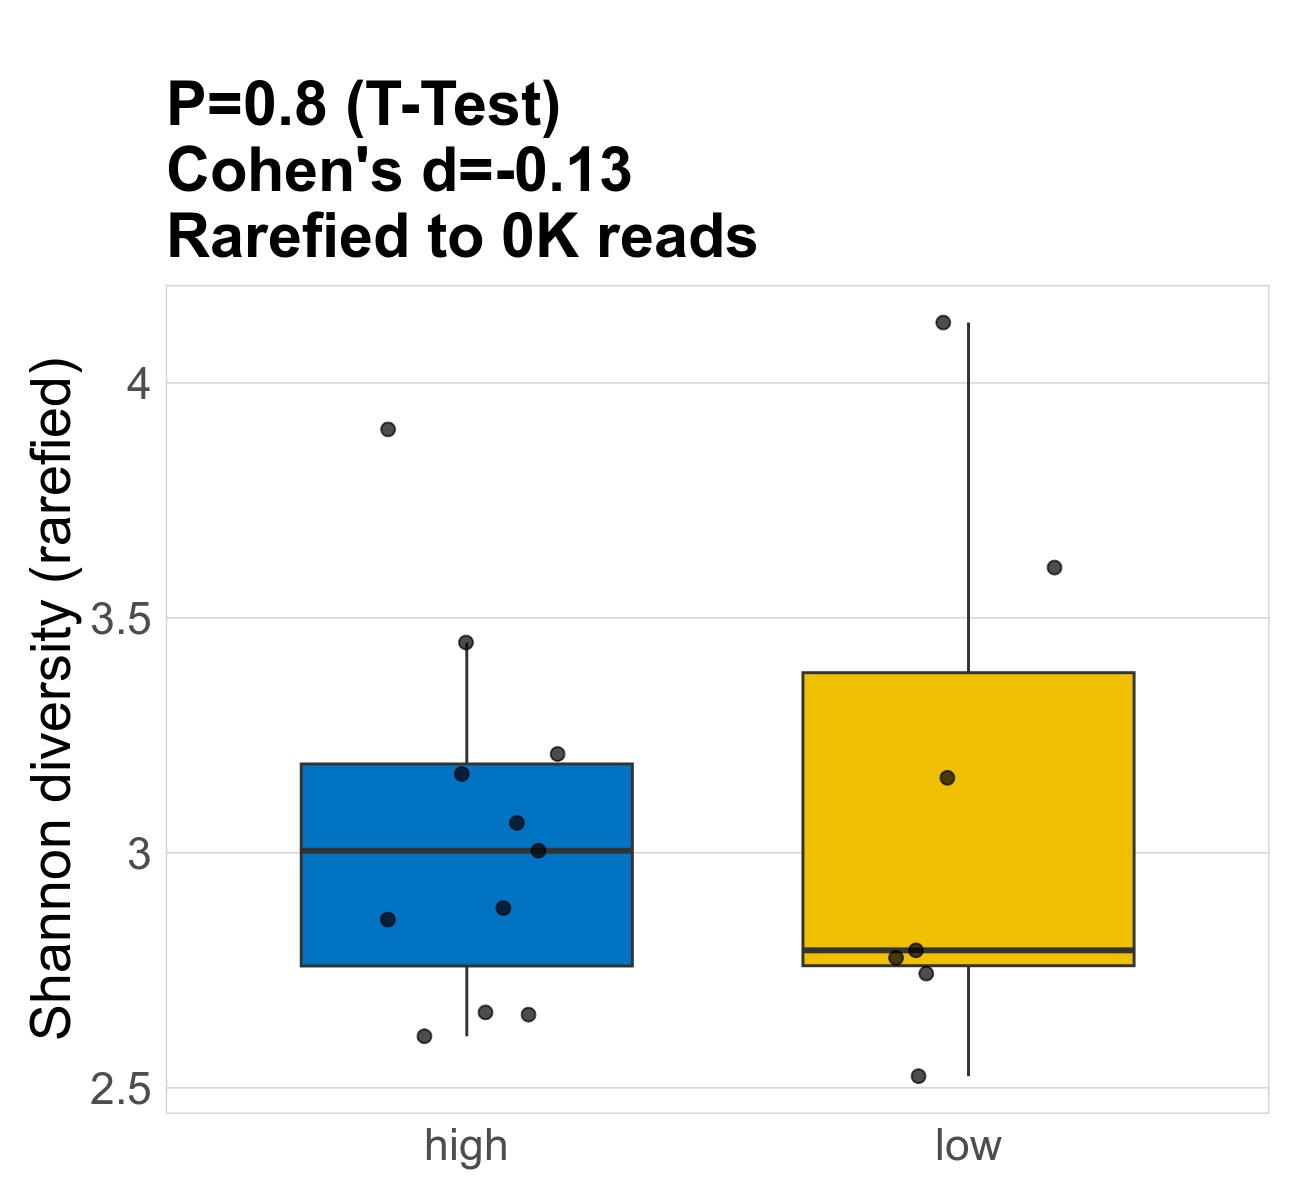
This page provides an overview of the functional alpha diversity of the analysed sample. Alpha diversity was measured using the Shannon index and functional richnes. Richness measures the total number of gene functions present in each sample. Shannon index combines richness and evenness.
| Index | rarefiedTo | P Welch's t-test | Mean Pos | Mean Abundance | Median Abundance | Mean Post_Treatment_Fibre_Intakehigh | Median Post_Treatment_Fibre_Intakehigh | SD Post_Treatment_Fibre_Intakehigh | Mean Post_Treatment_Fibre_Intakelow | Median Post_Treatment_Fibre_Intakelow | SD Post_Treatment_Fibre_Intakelow | Fold Change Log2(Post_Treatment_Fibre_Intakelow/Post_Treatment_Fibre_Intakehigh) | Positive samples | Positive Post_Treatment_Fibre_Intakehigh | Positive Post_Treatment_Fibre_Intakelow | Positive_Post_Treatment_Fibre_Intakehigh_percent | Positive_Post_Treatment_Fibre_Intakelow_percent |
|---|---|---|---|---|---|---|---|---|---|---|---|---|---|---|---|---|---|
| Shannon | 74 | 0.8 | 3.1 | 3.1 | 2.9 | 3 | 3 | 0.39 | 3.1 | 2.8 | 0.57 | 0.047 | 18 / 18 (100%) | 11 / 11 (100%) | 7 / 7 (100%) | 1 | 1 |
| Richness | 74 | 0.61 | 31 | 31 | 25 | 30 | 26 | 12 | 34 | 24 | 16 | 0.18 | 18 / 18 (100%) | 11 / 11 (100%) | 7 / 7 (100%) | 1 | 1 |
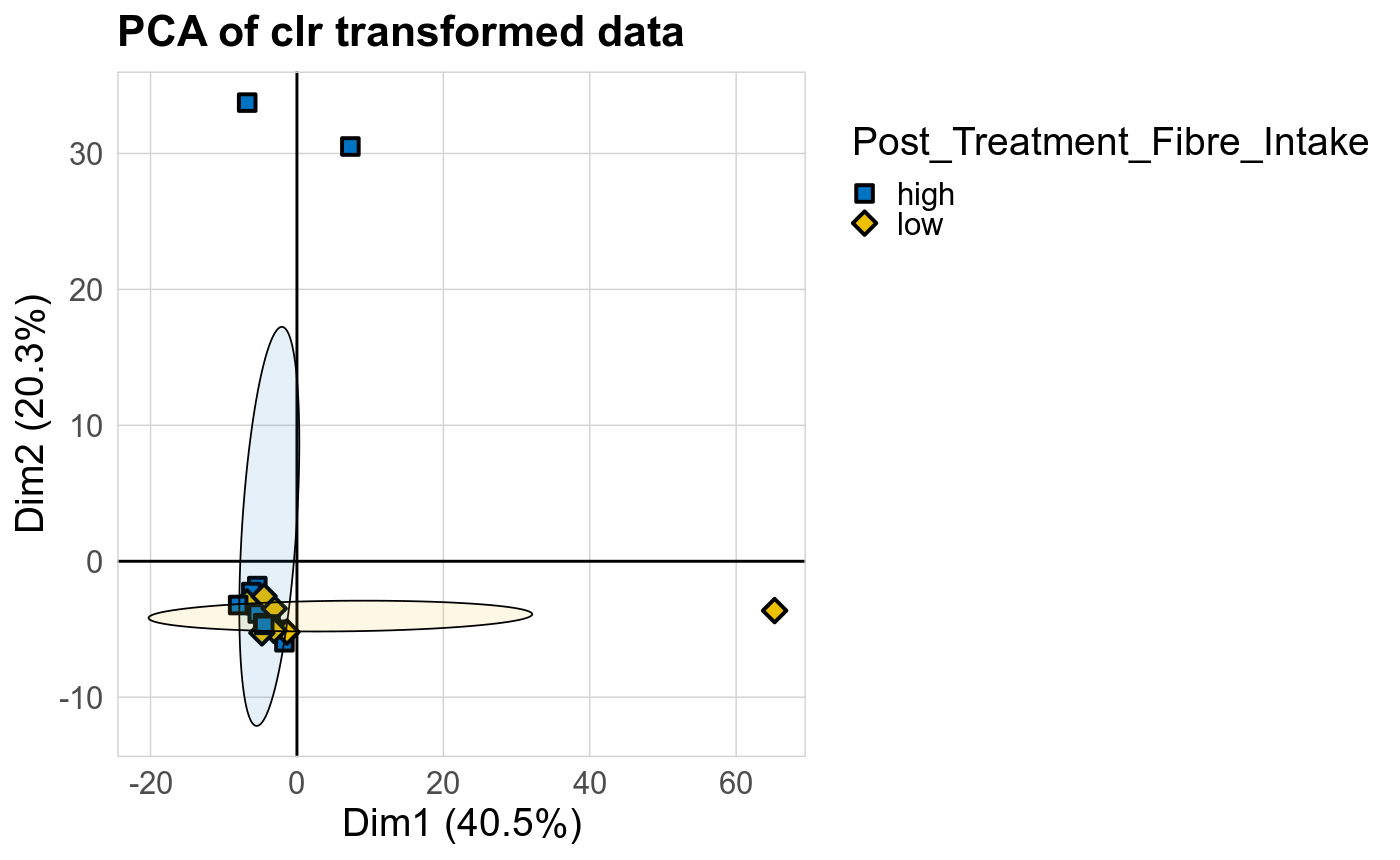
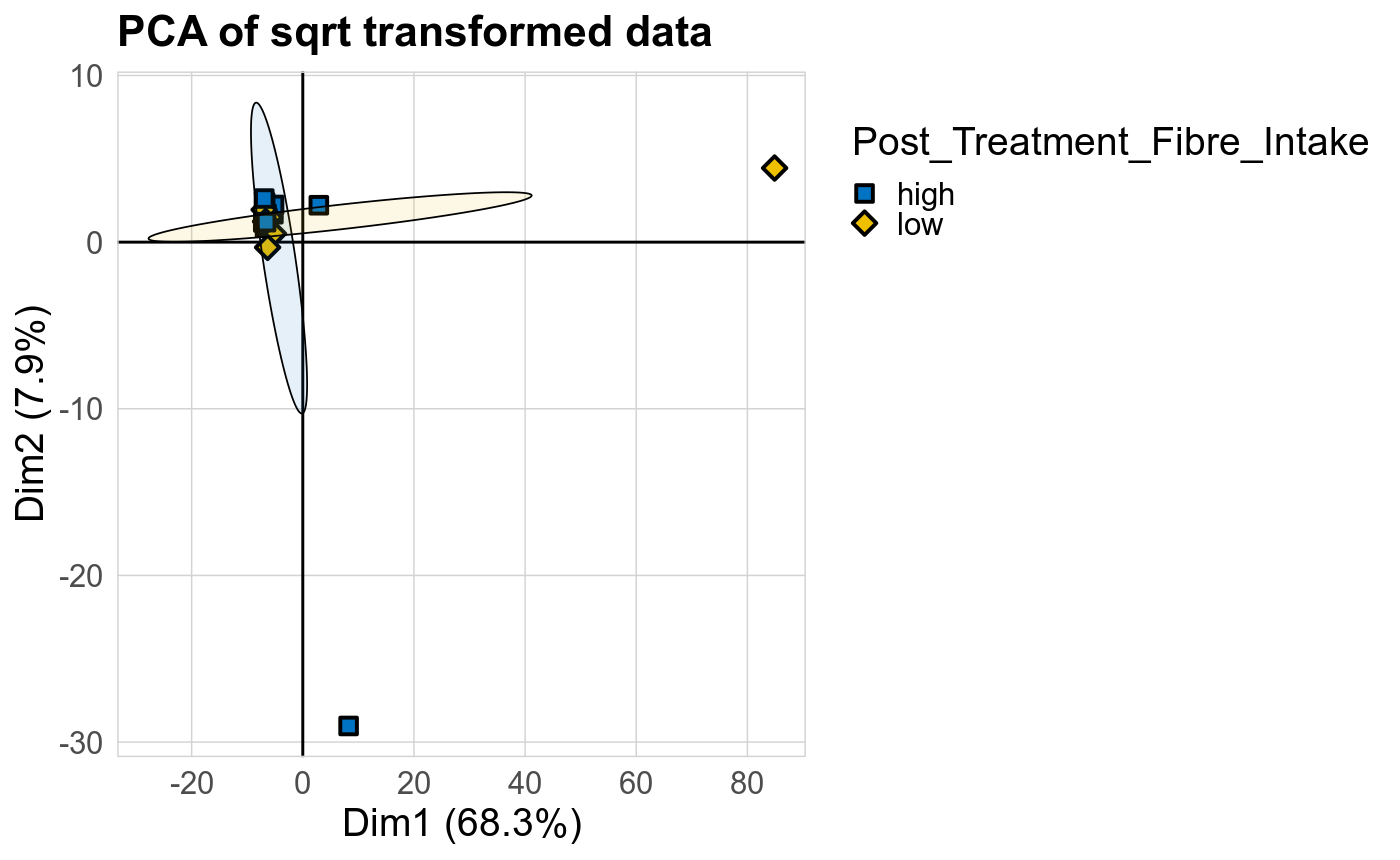
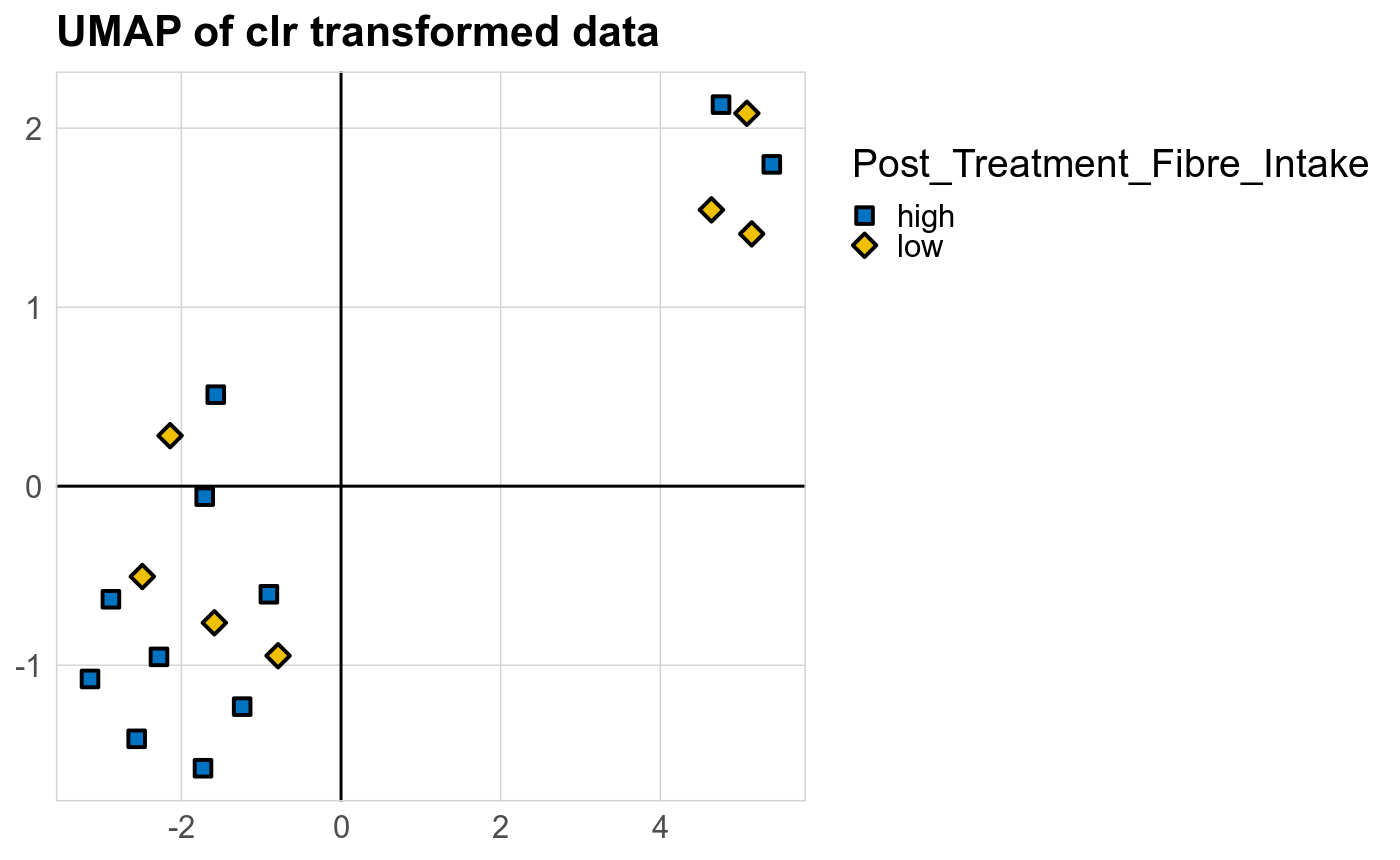
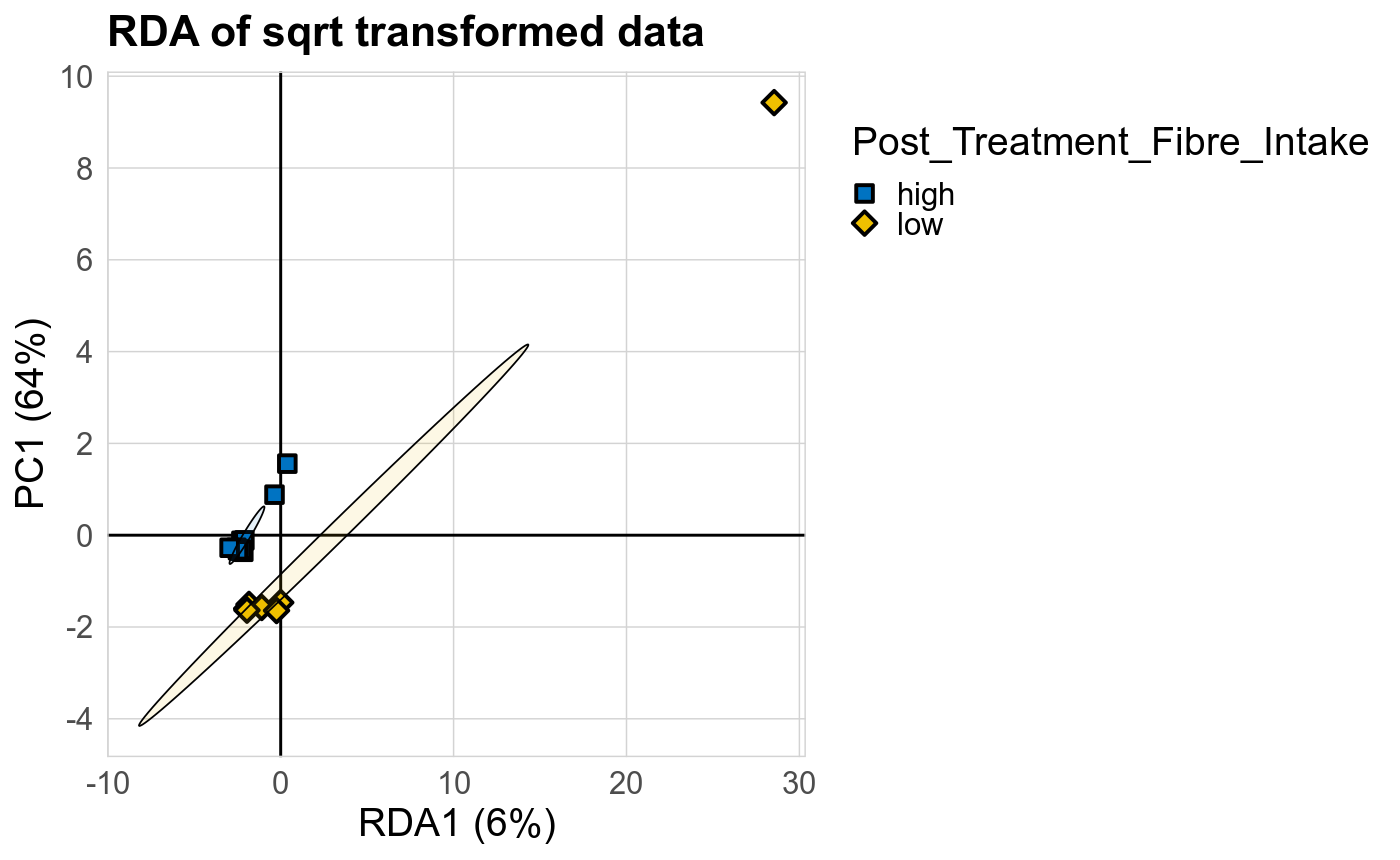
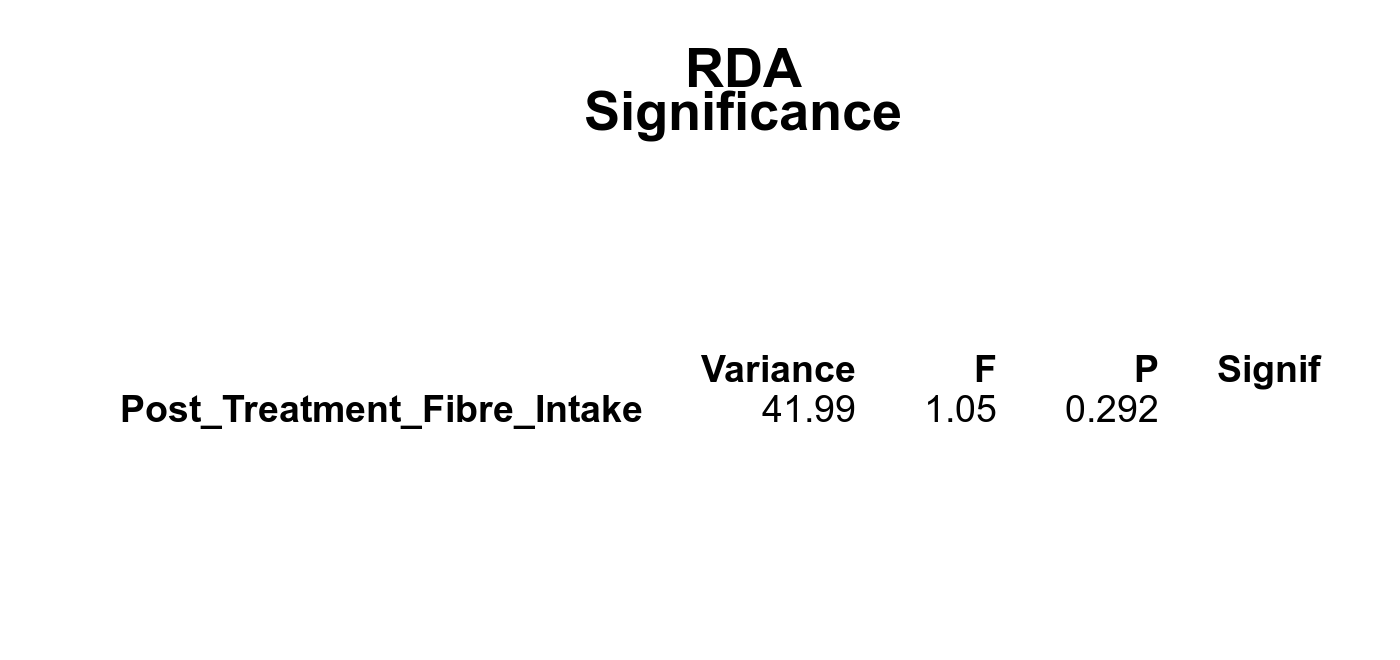
Microbial functions were analyzed using supervised and unsupervised multivariate techniques. Functional profiles were ordinated using the unsupervised methods Principal Coordinates Analysis (PCoA), Non-Metric Multidimensional Scaling (NMDS) and Principal Component Analysis (PCA). The supervised methods Adonis and Redundancy analysis (RDA) were used to assess if variance in the functional profiles was significantly associated with the study condition. A guide explaining these methods can be found here. Sparse Partial Least Square Discriminant Analysis (sPLS-DA) from the MixMc package was additionaly used to extract features associated with the condition of interest.
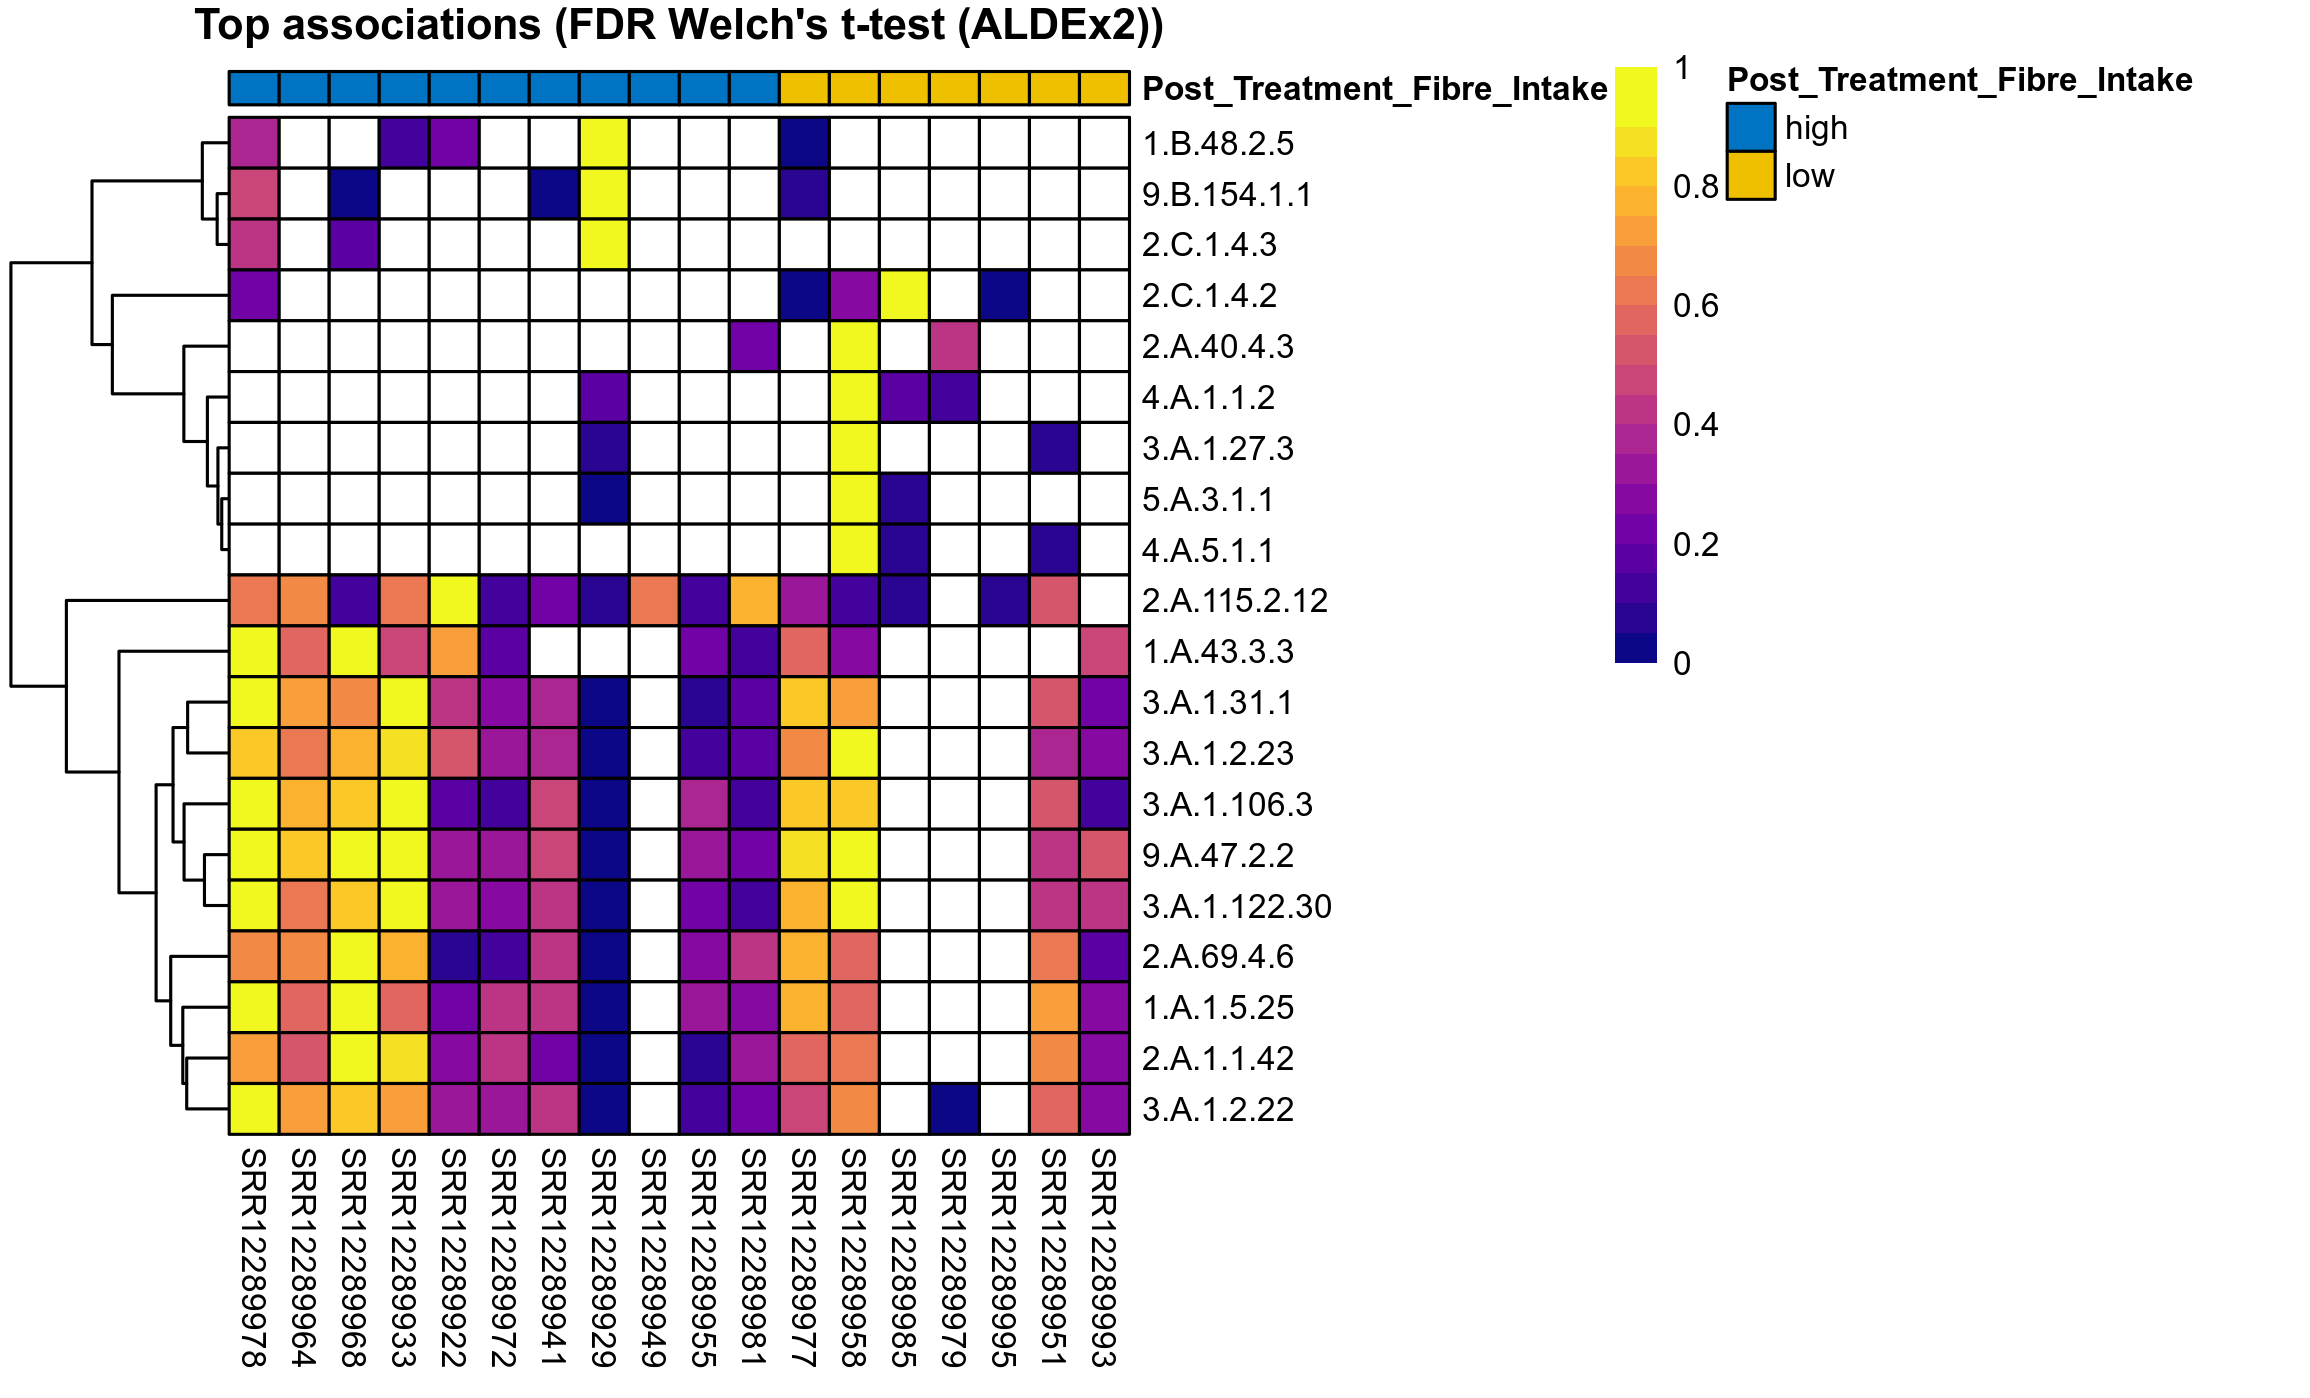
Differentially abundant microbial functions were identified using the univariate methods ANOVA or LMER (linear mixed effect regression) on clr transformed relative abundance data, Fisher's exact test, and Aldex2 (ANOVA-like Differential Expression). Aldex2 was run on read count data. Fisher's exact test was used to test for diffrerences in the presence and absence (detection rate) of microbial functions across study groups.
LMER is used for repeated measures data, using random effects to control for correlation between samples from the same subject. Fixed effects are included for treatment groups, time, and treatment over time, where appropriate. The LMER P values correspond to a nested model test of the significance of including the corresponding fixed effect.
ALDEx2 uses subsampling (Bayesian sampling) to estimate the underlying technical variation. For each subsample instance, center log-ratio transformed data is statistically compared across study groups and computed P values are corrected for multiple testing using the Benjamini–Hochberg procedure. The expected P value (mean P value) is reported, which are those that would likely have been observed if the same samples had been run multiple times. The expected values are reported for both the distribution of P values and for the distribution of Benjamini–Hochberg corrected values.
| Function | Annotation | P Welch's t-test (sqrt) | FDR Welch's t-test (sqrt) | Pbonf Welch's t-test (sqrt) | Cohen's d Welch's t-test (sqrt) | P Welch's t-test (clr) | FDR Welch's t-test (clr) | Pbonf Welch's t-test (clr) | Cohen's d Welch's t-test (clr) | P Fisher's exact test | FDR Fisher's exact test | Pbonf Fisher's exact test | P Welch's t-test (ALDEx2) | FDR Welch's t-test (ALDEx2) | P Wilcoxon rank test (ALDEx2) | FDR Wilcoxon rank test (ALDEx2) | Mean Pos | Mean Abundance | Median Abundance | Mean Post_Treatment_Fibre_Intakehigh | Median Post_Treatment_Fibre_Intakehigh | SD Post_Treatment_Fibre_Intakehigh | Mean Post_Treatment_Fibre_Intakelow | Median Post_Treatment_Fibre_Intakelow | SD Post_Treatment_Fibre_Intakelow | Fold Change Log2(Post_Treatment_Fibre_Intakelow/Post_Treatment_Fibre_Intakehigh) | Positive samples | Positive Post_Treatment_Fibre_Intakehigh | Positive Post_Treatment_Fibre_Intakelow | Positive_Post_Treatment_Fibre_Intakehigh_percent | Positive_Post_Treatment_Fibre_Intakelow_percent |
|---|---|---|---|---|---|---|---|---|---|---|---|---|---|---|---|---|---|---|---|---|---|---|---|---|---|---|---|---|---|---|---|
| 3.A.1.140.6 | The ATP-binding Cassette (ABC) Superfamily | 0.71 | 0.83 | 1 | 0.17 | 0.54 | 1 | 1 | 0.33 | 1 | 1 | 1 | 0.6 | 0.94 | 0.6 | 0.96 | 0.00018 | 3e-05 | 0 | 3.8e-05 | 0 | 1e-04 | 1.7e-05 | 0 | 4.5e-05 | -1.2 | 3 / 18 (17%) | 2 / 11 (18%) | 1 / 7 (14%) | 0.182 | 0.143 |
| 3.A.1.2.1 | The ATP-binding Cassette (ABC) Superfamily | 0.58 | 0.8 | 1 | -0.34 | 0.83 | 1 | 1 | 0.1 | 1 | 1 | 1 | 0.55 | 0.94 | 0.55 | 0.96 | 0.00046 | 7.7e-05 | 0 | 2.1e-05 | 0 | 4.7e-05 | 0.00016 | 0 | 0.00044 | 2.9 | 3 / 18 (17%) | 2 / 11 (18%) | 1 / 7 (14%) | 0.182 | 0.143 |
| 1.B.23.1.22 | The Cyanobacterial Porin (CBP) Family | 0.7 | 0.83 | 1 | -0.22 | 0.7 | 1 | 1 | 0.17 | 1 | 1 | 1 | 0.55 | 0.94 | 0.57 | 0.96 | 0.00059 | 9.8e-05 | 0 | 4.9e-05 | 0 | 0.00013 | 0.00017 | 0 | 0.00046 | 1.8 | 3 / 18 (17%) | 2 / 11 (18%) | 1 / 7 (14%) | 0.182 | 0.143 |
| 1.A.23.2.1 | The Small Conductance Mechanosensitive Ion Channel (MscS) Family | 0.74 | 0.85 | 1 | -0.19 | 0.5 | 1 | 1 | 0.28 | 1 | 1 | 1 | 0.53 | 0.94 | 0.55 | 0.96 | 0.00028 | 4.6e-05 | 0 | 2.6e-05 | 0 | 6.9e-05 | 7.7e-05 | 0 | 2e-04 | 1.6 | 3 / 18 (17%) | 2 / 11 (18%) | 1 / 7 (14%) | 0.182 | 0.143 |
| 3.B.1.1.2 | The Na+-transporting Carboxylic Acid Decarboxylase (NaT-DC) Family | 0.88 | 0.94 | 1 | 0.067 | 0.49 | 1 | 1 | 0.29 | 1 | 1 | 1 | 0.53 | 0.94 | 0.55 | 0.96 | 0.00018 | 4.1e-05 | 0 | 5.2e-05 | 0 | 0.00015 | 2.3e-05 | 0 | 5.1e-05 | -1.2 | 4 / 18 (22%) | 2 / 11 (18%) | 2 / 7 (29%) | 0.182 | 0.286 |
| 3.A.1.106.3 | The ATP-binding Cassette (ABC) Superfamily | 0.44 | 0.8 | 1 | 0.41 | 0.2 | 1 | 1 | 0.69 | 0.25 | 1 | 1 | 0.33 | 0.92 | 0.3 | 0.94 | 0.0014 | 0.0011 | 0.00071 | 0.0012 | 0.00098 | 0.0011 | 0.00088 | 0.00036 | 0.001 | -0.45 | 14 / 18 (78%) | 10 / 11 (91%) | 4 / 7 (57%) | 0.909 | 0.571 |
| 3.A.1.135.1 | The ATP-binding Cassette (ABC) Superfamily | 0.79 | 0.88 | 1 | 0.12 | 0.57 | 1 | 1 | 0.31 | 1 | 1 | 1 | 0.59 | 0.94 | 0.61 | 0.97 | 0.00018 | 3e-05 | 0 | 3.4e-05 | 0 | 7.8e-05 | 2.3e-05 | 0 | 6.1e-05 | -0.56 | 3 / 18 (17%) | 2 / 11 (18%) | 1 / 7 (14%) | 0.182 | 0.143 |
| 1.A.35.4.1 | The CorA Metal Ion Transporter (MIT) Family | 0.61 | 0.8 | 1 | -0.31 | 0.73 | 1 | 1 | 0.15 | 1 | 1 | 1 | 0.48 | 0.93 | 0.53 | 0.96 | 0.00023 | 3.8e-05 | 0 | 1.3e-05 | 0 | 3.5e-05 | 7.7e-05 | 0 | 2e-04 | 2.6 | 3 / 18 (17%) | 2 / 11 (18%) | 1 / 7 (14%) | 0.182 | 0.143 |
| 2.A.55.3.1 | The Metal Ion (Mn2+-iron) Transporter (Nramp) Family | 0.63 | 0.8 | 1 | -0.29 | 0.65 | 1 | 1 | 0.2 | 1 | 1 | 1 | 0.49 | 0.94 | 0.54 | 0.96 | 0.00026 | 4.3e-05 | 0 | 1.6e-05 | 0 | 3.7e-05 | 8.7e-05 | 0 | 0.00023 | 2.4 | 3 / 18 (17%) | 2 / 11 (18%) | 1 / 7 (14%) | 0.182 | 0.143 |
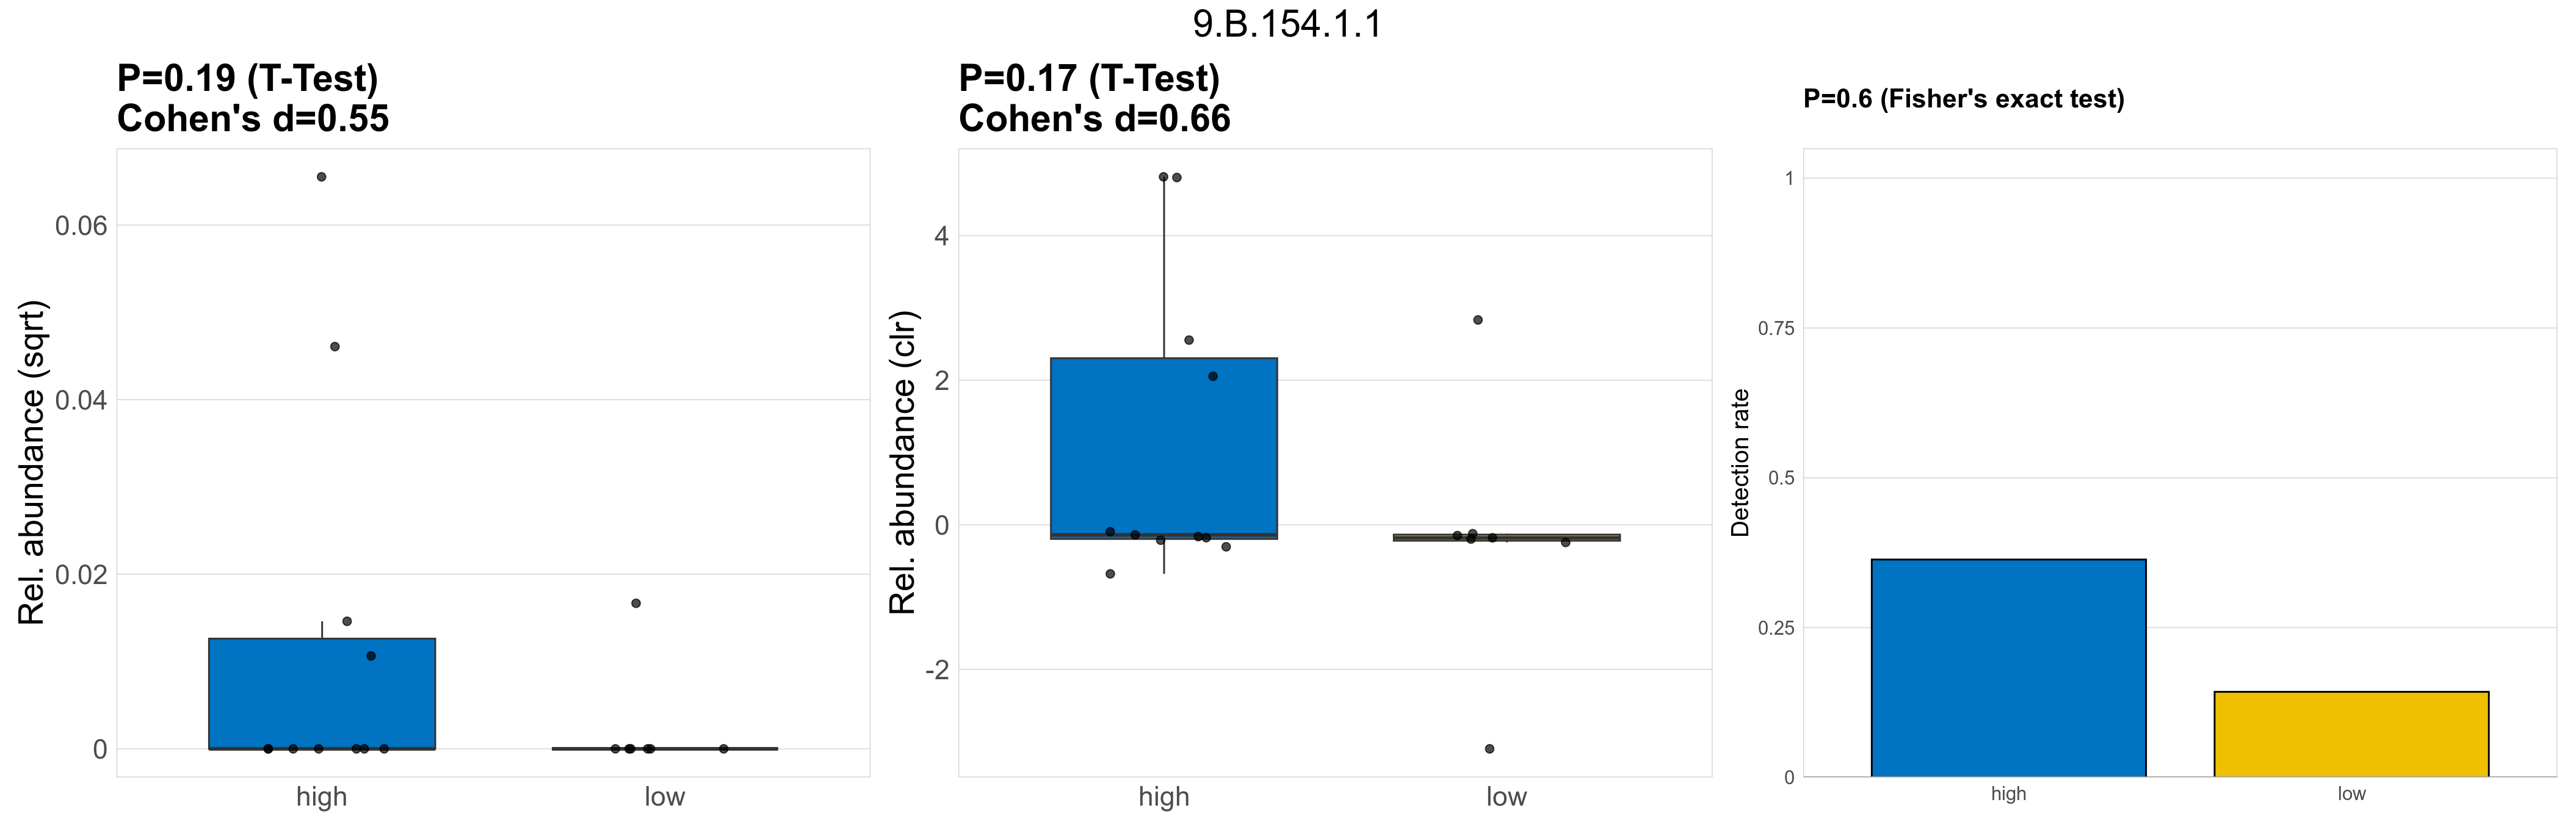
| 9.B.154.1.1 | The Putative Holin-2 (PH-2) Family | 0.19 | 0.8 | 1 | 0.55 | 0.17 | 1 | 1 | 0.66 | 0.6 | 1 | 1 | 0.41 | 0.92 | 0.44 | 0.95 | 0.0014 | 0.00039 | 0 | 0.00061 | 0 | 0.0014 | 4e-05 | 0 | 0.00011 | -3.9 | 5 / 18 (28%) | 4 / 11 (36%) | 1 / 7 (14%) | 0.364 | 0.143 |
| 2.A.76.1.3 | The Resistance to Homoserine/Threonine (RhtB) Family | 0.8 | 0.88 | 1 | -0.14 | 0.45 | 1 | 1 | 0.31 | 1 | 1 | 1 | 0.5 | 0.93 | 0.54 | 0.95 | 0.00022 | 3.7e-05 | 0 | 2.3e-05 | 0 | 5.2e-05 | 5.8e-05 | 0 | 0.00015 | 1.3 | 3 / 18 (17%) | 2 / 11 (18%) | 1 / 7 (14%) | 0.182 | 0.143 |
| 2.A.2.3.1 | The Glycoside-Pentoside-Hexuronide (GPH):Cation Symporter Family | 0.61 | 0.8 | 1 | -0.31 | 0.73 | 1 | 1 | 0.14 | 1 | 1 | 1 | 0.55 | 0.94 | 0.56 | 0.96 | 0.00017 | 2.8e-05 | 0 | 9.5e-06 | 0 | 2.3e-05 | 5.8e-05 | 0 | 0.00015 | 2.6 | 3 / 18 (17%) | 2 / 11 (18%) | 1 / 7 (14%) | 0.182 | 0.143 |
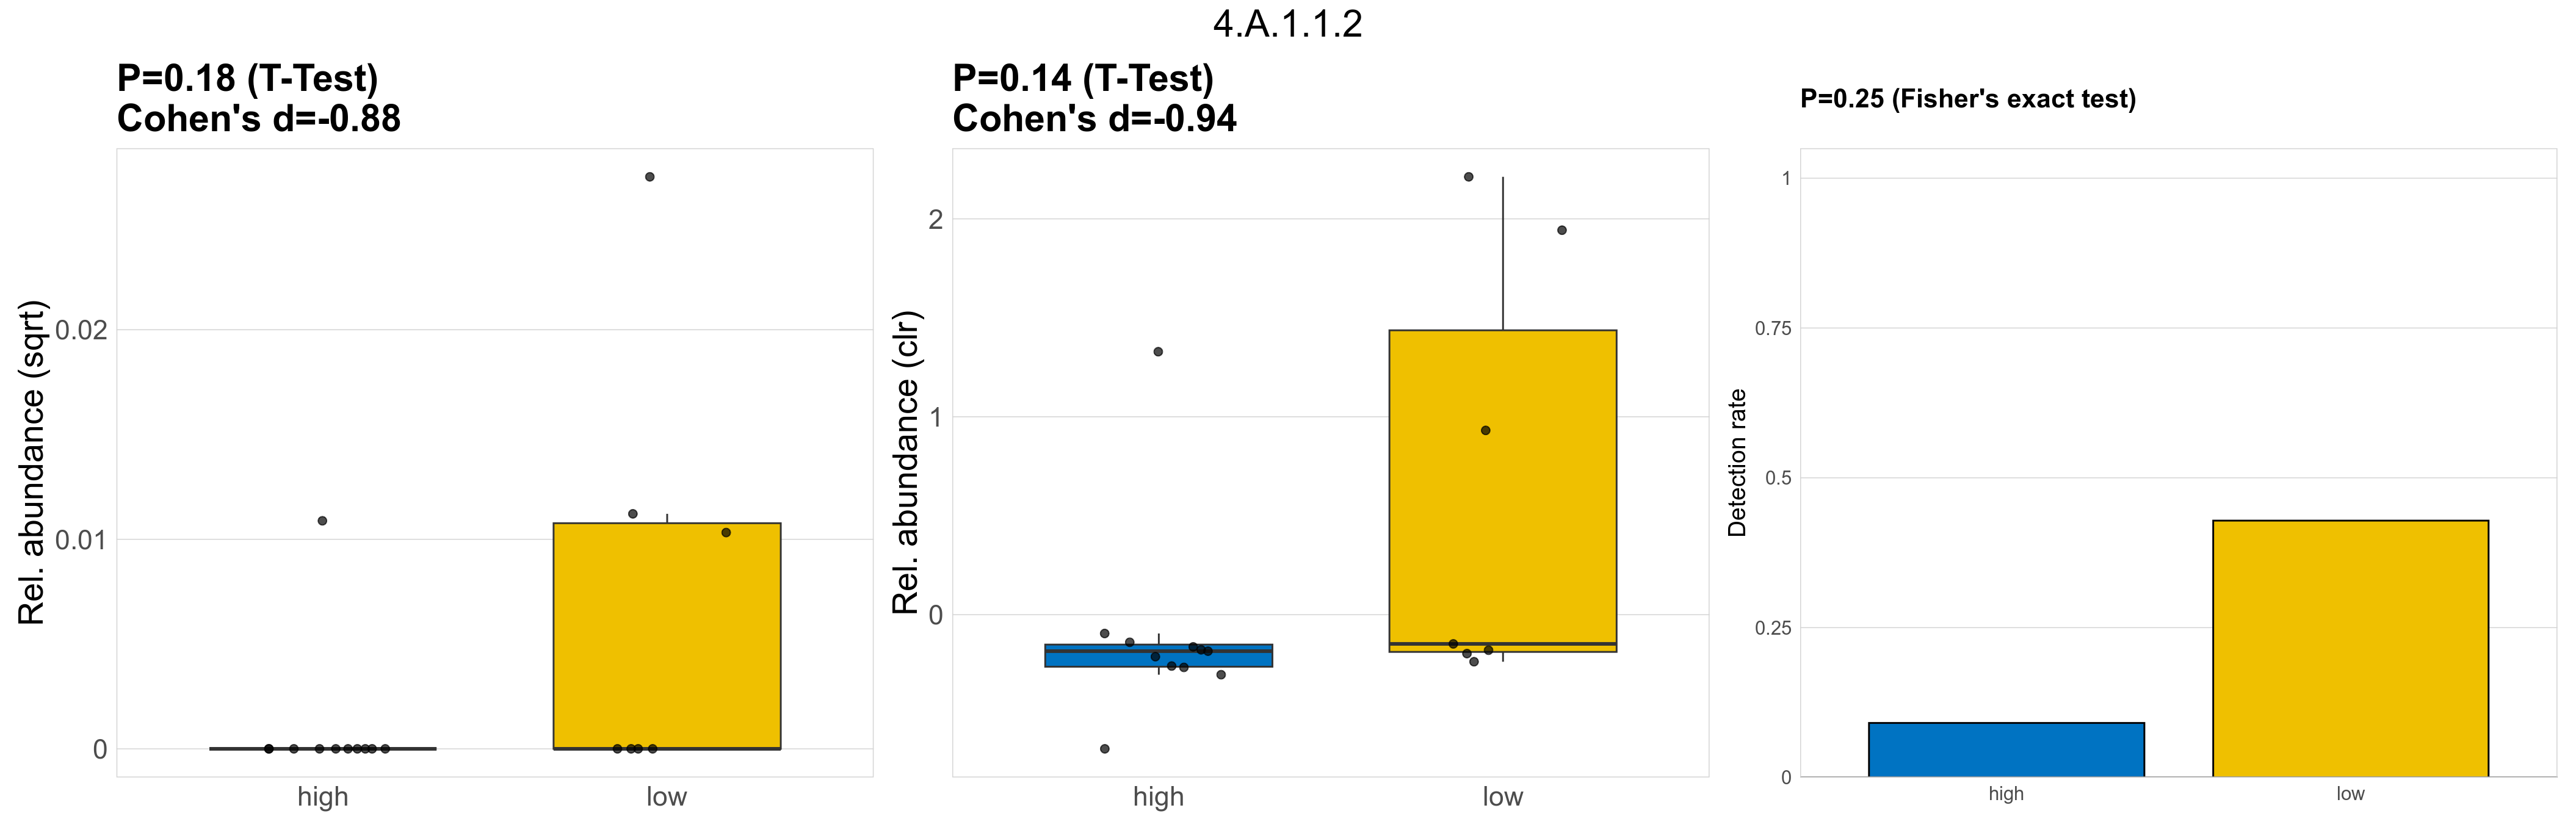
| 4.A.1.1.2 | The PTS Glucose-Glucoside (Glc) Family | 0.18 | 0.8 | 1 | -0.88 | 0.14 | 1 | 1 | -0.94 | 0.25 | 1 | 1 | 0.4 | 0.91 | 0.43 | 0.93 | 0.00027 | 6.1e-05 | 0 | 1.1e-05 | 0 | 3.6e-05 | 0.00014 | 0 | 0.00027 | 3.7 | 4 / 18 (22%) | 1 / 11 (9.1%) | 3 / 7 (43%) | 0.0909 | 0.429 |
| 3.A.1.4.1 | The ATP-binding Cassette (ABC) Superfamily | 0.41 | 0.8 | 1 | -0.52 | 0.54 | 1 | 1 | -0.33 | 1 | 1 | 1 | 0.51 | 0.94 | 0.53 | 0.95 | 0.00093 | 0.00021 | 0 | 3.4e-05 | 0 | 7.8e-05 | 0.00048 | 0 | 0.0012 | 3.8 | 4 / 18 (22%) | 2 / 11 (18%) | 2 / 7 (29%) | 0.182 | 0.286 |
| 8.A.46.1.1 | The Glycan-binding Protein (SusD) Family | 0.53 | 0.8 | 1 | -0.32 | 0.82 | 1 | 1 | 0.13 | 0.53 | 1 | 1 | 0.57 | 0.94 | 0.59 | 0.96 | 4.1e-05 | 6.9e-06 | 0 | 6e-06 | 0 | 2e-05 | 8.3e-06 | 0 | 1.4e-05 | 0.47 | 3 / 18 (17%) | 1 / 11 (9.1%) | 2 / 7 (29%) | 0.0909 | 0.286 |
| 1.B.14.1.9 | The Outer Membrane Receptor (OMR) Family | 0.53 | 0.8 | 1 | -0.39 | 0.99 | 1 | 1 | -0.0065 | 1 | 1 | 1 | 0.49 | 0.93 | 0.54 | 0.96 | 0.00049 | 8.1e-05 | 0 | 1.6e-05 | 0 | 3.7e-05 | 0.00018 | 0 | 0.00049 | 3.5 | 3 / 18 (17%) | 2 / 11 (18%) | 1 / 7 (14%) | 0.182 | 0.143 |
| 2.A.1.21.22 | The Major Facilitator Superfamily (MFS) | 0.91 | 0.96 | 1 | -0.051 | 0.9 | 1 | 1 | 0.065 | 1 | 1 | 1 | 0.61 | 0.95 | 0.66 | 0.97 | 0.00021 | 1e-04 | 1.3e-05 | 0.00011 | 0 | 0.00027 | 8.9e-05 | 2.7e-05 | 0.00013 | -0.31 | 9 / 18 (50%) | 5 / 11 (45%) | 4 / 7 (57%) | 0.455 | 0.571 |
| 2.A.17.1.5 | The Proton-dependent Oligopeptide Transporter (POT/PTR) Family | 0.27 | 0.8 | 1 | -0.71 | 0.27 | 1 | 1 | -0.7 | 0.53 | 1 | 1 | 0.43 | 0.93 | 0.46 | 0.95 | 0.00024 | 4e-05 | 0 | 5.4e-06 | 0 | 1.8e-05 | 9.4e-05 | 0 | 2e-04 | 4.1 | 3 / 18 (17%) | 1 / 11 (9.1%) | 2 / 7 (29%) | 0.0909 | 0.286 |
| 2.A.6.4.1 | The Resistance-Nodulation-Cell Division (RND) Superfamily | 0.42 | 0.8 | 1 | -0.49 | 0.51 | 1 | 1 | -0.34 | 1 | 1 | 1 | 0.5 | 0.93 | 0.55 | 0.95 | 0.00053 | 0.00012 | 0 | 3.4e-05 | 0 | 1e-04 | 0.00025 | 0 | 0.00061 | 2.9 | 4 / 18 (22%) | 2 / 11 (18%) | 2 / 7 (29%) | 0.182 | 0.286 |
| 2.A.21.3.19 | The Solute:Sodium Symporter (SSS) Family | 0.57 | 0.8 | 1 | -0.28 | 0.57 | 1 | 1 | -0.27 | 0.37 | 1 | 1 | 0.55 | 0.94 | 0.63 | 0.96 | 0.00087 | 0.00048 | 9.5e-05 | 0.00044 | 0 | 0.00077 | 0.00055 | 0.00012 | 0.00079 | 0.32 | 10 / 18 (56%) | 5 / 11 (45%) | 5 / 7 (71%) | 0.455 | 0.714 |
| 2.A.1.1.42 | The Major Facilitator Superfamily (MFS) | 0.41 | 0.8 | 1 | 0.43 | 0.19 | 1 | 1 | 0.72 | 0.25 | 1 | 1 | 0.31 | 0.92 | 0.31 | 0.94 | 0.0013 | 0.001 | 0.00081 | 0.0011 | 0.00091 | 0.00096 | 0.00085 | 0.00072 | 0.00087 | -0.37 | 14 / 18 (78%) | 10 / 11 (91%) | 4 / 7 (57%) | 0.909 | 0.571 |
| 3.A.1.11.7 | The ATP-binding Cassette (ABC) Superfamily | 0.87 | 0.93 | 1 | -0.085 | 0.8 | 1 | 1 | 0.14 | 1 | 1 | 1 | 0.61 | 0.95 | 0.64 | 0.97 | 2e-04 | 6.6e-05 | 0 | 5.6e-05 | 0 | 1e-04 | 8.2e-05 | 0 | 0.00015 | 0.55 | 6 / 18 (33%) | 4 / 11 (36%) | 2 / 7 (29%) | 0.364 | 0.286 |
| 8.A.1.1.3 | The Membrane Fusion Protein (MFP) Family | 0.29 | 0.8 | 1 | -0.66 | 0.35 | 1 | 1 | -0.55 | 0.53 | 1 | 1 | 0.52 | 0.94 | 0.56 | 0.96 | 2e-04 | 3.4e-05 | 0 | 8.1e-06 | 0 | 2.7e-05 | 7.5e-05 | 0 | 0.00015 | 3.2 | 3 / 18 (17%) | 1 / 11 (9.1%) | 2 / 7 (29%) | 0.0909 | 0.286 |
| 8.A.42.1.6 | The small hydrophilic YodL domain/protein (YodL) Family | 0.93 | 0.96 | 1 | -0.038 | 0.88 | 1 | 1 | -0.079 | 0.37 | 1 | 1 | 0.71 | 0.96 | 0.74 | 0.98 | 0.00064 | 0.00036 | 0.00019 | 4e-04 | 0 | 0.00057 | 0.00028 | 0.00025 | 0.00029 | -0.51 | 10 / 18 (56%) | 5 / 11 (45%) | 5 / 7 (71%) | 0.455 | 0.714 |
| 9.B.307.1.2 | The FtsH AAA(+) Zinc Metaloprotease (FtsH) Family | 0.54 | 0.8 | 1 | -0.39 | 0.99 | 1 | 1 | 0.0063 | 1 | 1 | 1 | 0.49 | 0.92 | 0.54 | 0.94 | 0.00046 | 7.7e-05 | 0 | 1.6e-05 | 0 | 3.7e-05 | 0.00017 | 0 | 0.00046 | 3.4 | 3 / 18 (17%) | 2 / 11 (18%) | 1 / 7 (14%) | 0.182 | 0.143 |
| 3.A.1.2.27 | The ATP-binding Cassette (ABC) Superfamily | 0.58 | 0.8 | 1 | -0.34 | 0.89 | 1 | 1 | 0.066 | 1 | 1 | 1 | 0.51 | 0.94 | 0.55 | 0.96 | 0.00055 | 9.1e-05 | 0 | 2.6e-05 | 0 | 6.9e-05 | 0.00019 | 0 | 0.00051 | 2.9 | 3 / 18 (17%) | 2 / 11 (18%) | 1 / 7 (14%) | 0.182 | 0.143 |
| 2.A.33.1.5 | The NhaA Na+:H+ Antiporter (NhaA) Family | 0.97 | 0.98 | 1 | 0.024 | 0.37 | 1 | 1 | 0.47 | 0.33 | 1 | 1 | 0.56 | 0.94 | 0.48 | 0.96 | 0.00071 | 0.00051 | 0.00044 | 0.00044 | 0.00044 | 0.00034 | 0.00063 | 0.00024 | 0.00076 | 0.52 | 13 / 18 (72%) | 9 / 11 (82%) | 4 / 7 (57%) | 0.818 | 0.571 |
| 2.A.3.1.4 | The Amino Acid-Polyamine-Organocation (APC) Family | 0.29 | 0.8 | 1 | -0.67 | 0.32 | 1 | 1 | -0.55 | 0.33 | 1 | 1 | 0.48 | 0.93 | 0.53 | 0.96 | 0.00023 | 6.3e-05 | 0 | 1.5e-05 | 0 | 3.3e-05 | 0.00014 | 0 | 3e-04 | 3.2 | 5 / 18 (28%) | 2 / 11 (18%) | 3 / 7 (43%) | 0.182 | 0.429 |
| 3.A.1.5.1 | The ATP-binding Cassette (ABC) Superfamily | 0.56 | 0.8 | 1 | -0.36 | 0.91 | 1 | 1 | 0.052 | 1 | 1 | 1 | 0.5 | 0.94 | 0.53 | 0.95 | 4e-04 | 6.6e-05 | 0 | 1.6e-05 | 0 | 3.7e-05 | 0.00015 | 0 | 0.00038 | 3.2 | 3 / 18 (17%) | 2 / 11 (18%) | 1 / 7 (14%) | 0.182 | 0.143 |
| 2.A.40.1.1 | The Nucleobase/Ascorbate Transporter (NAT) or Nucleobase:Cation Symporter-2 (NCS2) Family | 0.61 | 0.8 | 1 | -0.3 | 0.71 | 1 | 1 | 0.17 | 1 | 1 | 1 | 0.48 | 0.93 | 0.5 | 0.95 | 0.00028 | 4.7e-05 | 0 | 1.6e-05 | 0 | 3.7e-05 | 9.7e-05 | 0 | 0.00026 | 2.6 | 3 / 18 (17%) | 2 / 11 (18%) | 1 / 7 (14%) | 0.182 | 0.143 |
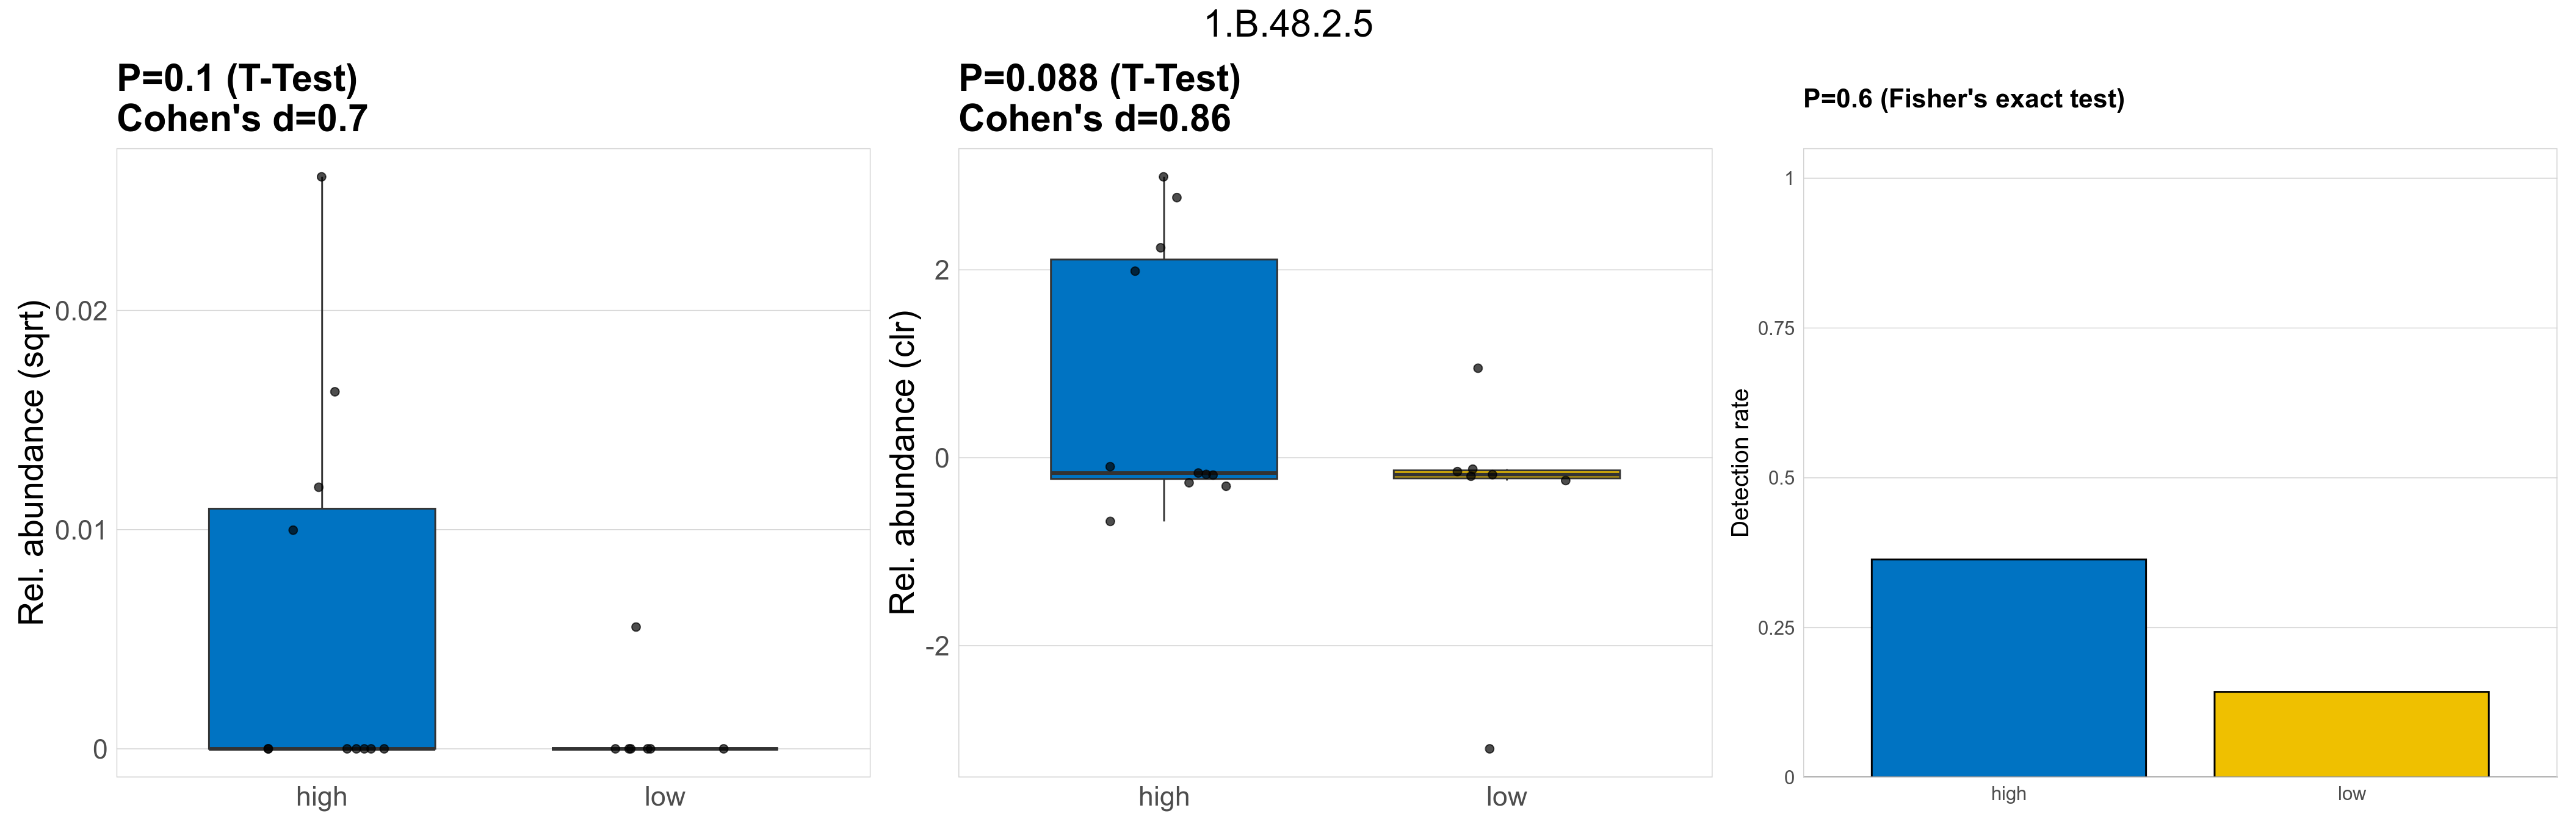
| 1.B.48.2.5 | The Curli Fiber Subunit Porin. CgsA. CsgG (CsgG) Family | 0.1 | 0.8 | 1 | 0.7 | 0.088 | 1 | 1 | 0.86 | 0.6 | 1 | 1 | 0.4 | 0.93 | 0.4 | 0.94 | 0.00024 | 6.8e-05 | 0 | 0.00011 | 0 | 0.00021 | 4.4e-06 | 0 | 1.2e-05 | -4.6 | 5 / 18 (28%) | 4 / 11 (36%) | 1 / 7 (14%) | 0.364 | 0.143 |
| 9.A.47.2.2 | The Tight Adherence (Pilus) Biogenesis Apparatus (TABA) Family | 0.48 | 0.8 | 1 | 0.38 | 0.22 | 1 | 1 | 0.67 | 0.25 | 1 | 1 | 0.31 | 0.91 | 0.31 | 0.94 | 0.0024 | 0.0018 | 0.0015 | 0.002 | 0.0013 | 0.0015 | 0.0016 | 0.0017 | 0.0017 | -0.32 | 14 / 18 (78%) | 10 / 11 (91%) | 4 / 7 (57%) | 0.909 | 0.571 |
| 3.A.10.1.10 | The H+. Na+-translocating Pyrophosphatase (M+-PPase) Family | 0.46 | 0.8 | 1 | 0.31 | 0.66 | 1 | 1 | 0.22 | 1 | 1 | 1 | 0.67 | 0.95 | 0.74 | 0.97 | 0.0011 | 0.00061 | 6.8e-05 | 0.00085 | 2.9e-05 | 0.0017 | 0.00023 | 0.00011 | 0.00035 | -1.9 | 10 / 18 (56%) | 6 / 11 (55%) | 4 / 7 (57%) | 0.545 | 0.571 |
| 2.A.13.1.1 | The C4-Dicarboxylate Uptake (Dcu) Family | 0.57 | 0.8 | 1 | -0.35 | 0.86 | 1 | 1 | 0.076 | 1 | 1 | 1 | 0.5 | 0.94 | 0.52 | 0.96 | 0.00022 | 3.6e-05 | 0 | 9.5e-06 | 0 | 2.3e-05 | 7.7e-05 | 0 | 2e-04 | 3 | 3 / 18 (17%) | 2 / 11 (18%) | 1 / 7 (14%) | 0.182 | 0.143 |
| 2.A.37.1.1 | The Monovalent Cation:Proton Antiporter-2 (CPA2) Family | 0.46 | 0.8 | 1 | -0.47 | 0.68 | 1 | 1 | -0.2 | 1 | 1 | 1 | 0.51 | 0.94 | 0.54 | 0.96 | 3e-04 | 6.7e-05 | 0 | 1.5e-05 | 0 | 3.3e-05 | 0.00015 | 0 | 0.00038 | 3.3 | 4 / 18 (22%) | 2 / 11 (18%) | 2 / 7 (29%) | 0.182 | 0.286 |
| 3.A.1.7.1 | The ATP-binding Cassette (ABC) Superfamily | 0.37 | 0.8 | 1 | -0.59 | 0.4 | 1 | 1 | -0.48 | 1 | 1 | 1 | 0.49 | 0.93 | 0.51 | 0.95 | 0.00063 | 0.00014 | 0 | 1.5e-05 | 0 | 3.3e-05 | 0.00033 | 0 | 0.00084 | 4.5 | 4 / 18 (22%) | 2 / 11 (18%) | 2 / 7 (29%) | 0.182 | 0.286 |
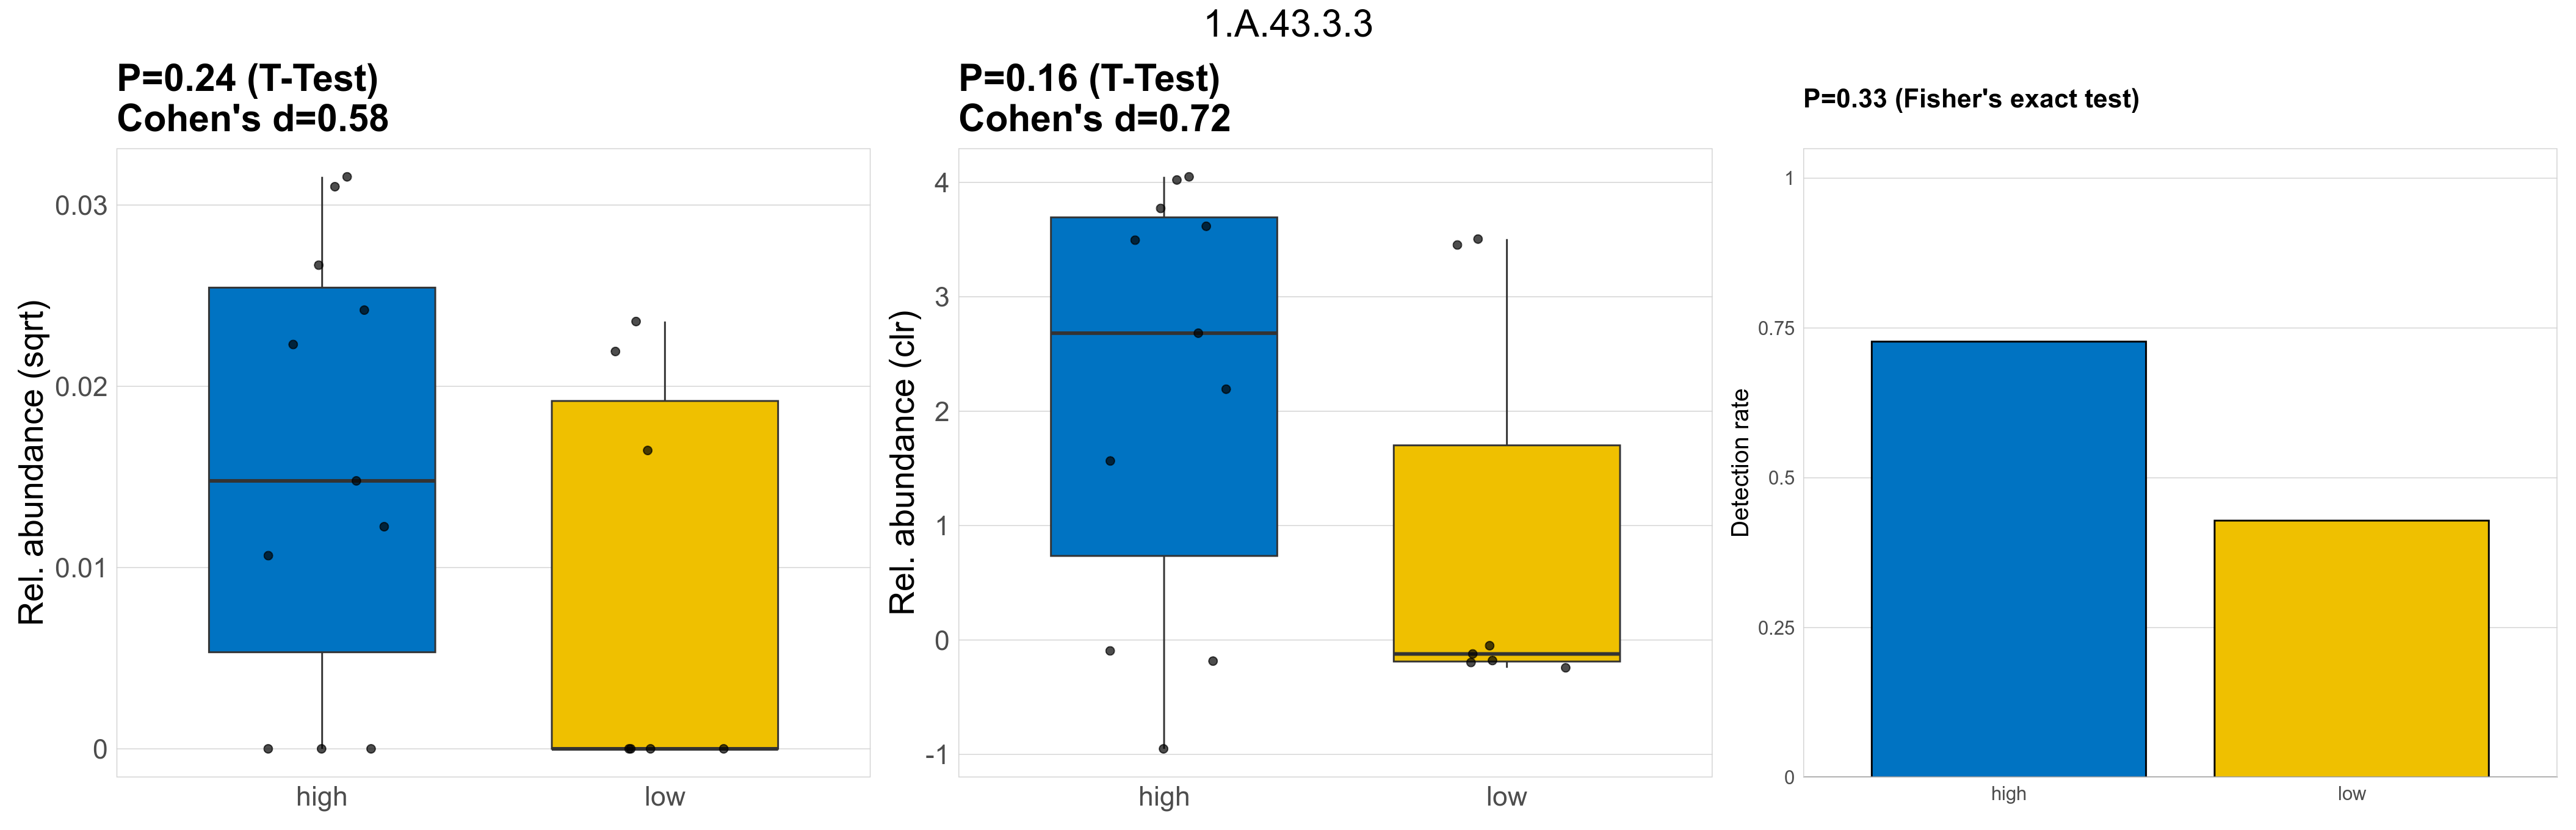
| 1.A.43.3.3 | The Camphor Resistance or Fluoride Exporter (Fluc) Family | 0.24 | 0.8 | 1 | 0.58 | 0.16 | 1 | 1 | 0.72 | 0.33 | 1 | 1 | 0.39 | 0.92 | 0.33 | 0.94 | 5e-04 | 0.00031 | 0.00018 | 0.00039 | 0.00022 | 0.00038 | 0.00019 | 0 | 0.00025 | -1 | 11 / 18 (61%) | 8 / 11 (73%) | 3 / 7 (43%) | 0.727 | 0.429 |
| 2.A.3.1.7 | The Amino Acid-Polyamine-Organocation (APC) Family | 0.29 | 0.8 | 1 | -0.7 | 0.22 | 1 | 1 | -0.78 | 0.53 | 1 | 1 | 0.43 | 0.93 | 0.49 | 0.95 | 0.00033 | 5.4e-05 | 0 | 5.4e-06 | 0 | 1.8e-05 | 0.00013 | 0 | 3e-04 | 4.6 | 3 / 18 (17%) | 1 / 11 (9.1%) | 2 / 7 (29%) | 0.0909 | 0.286 |
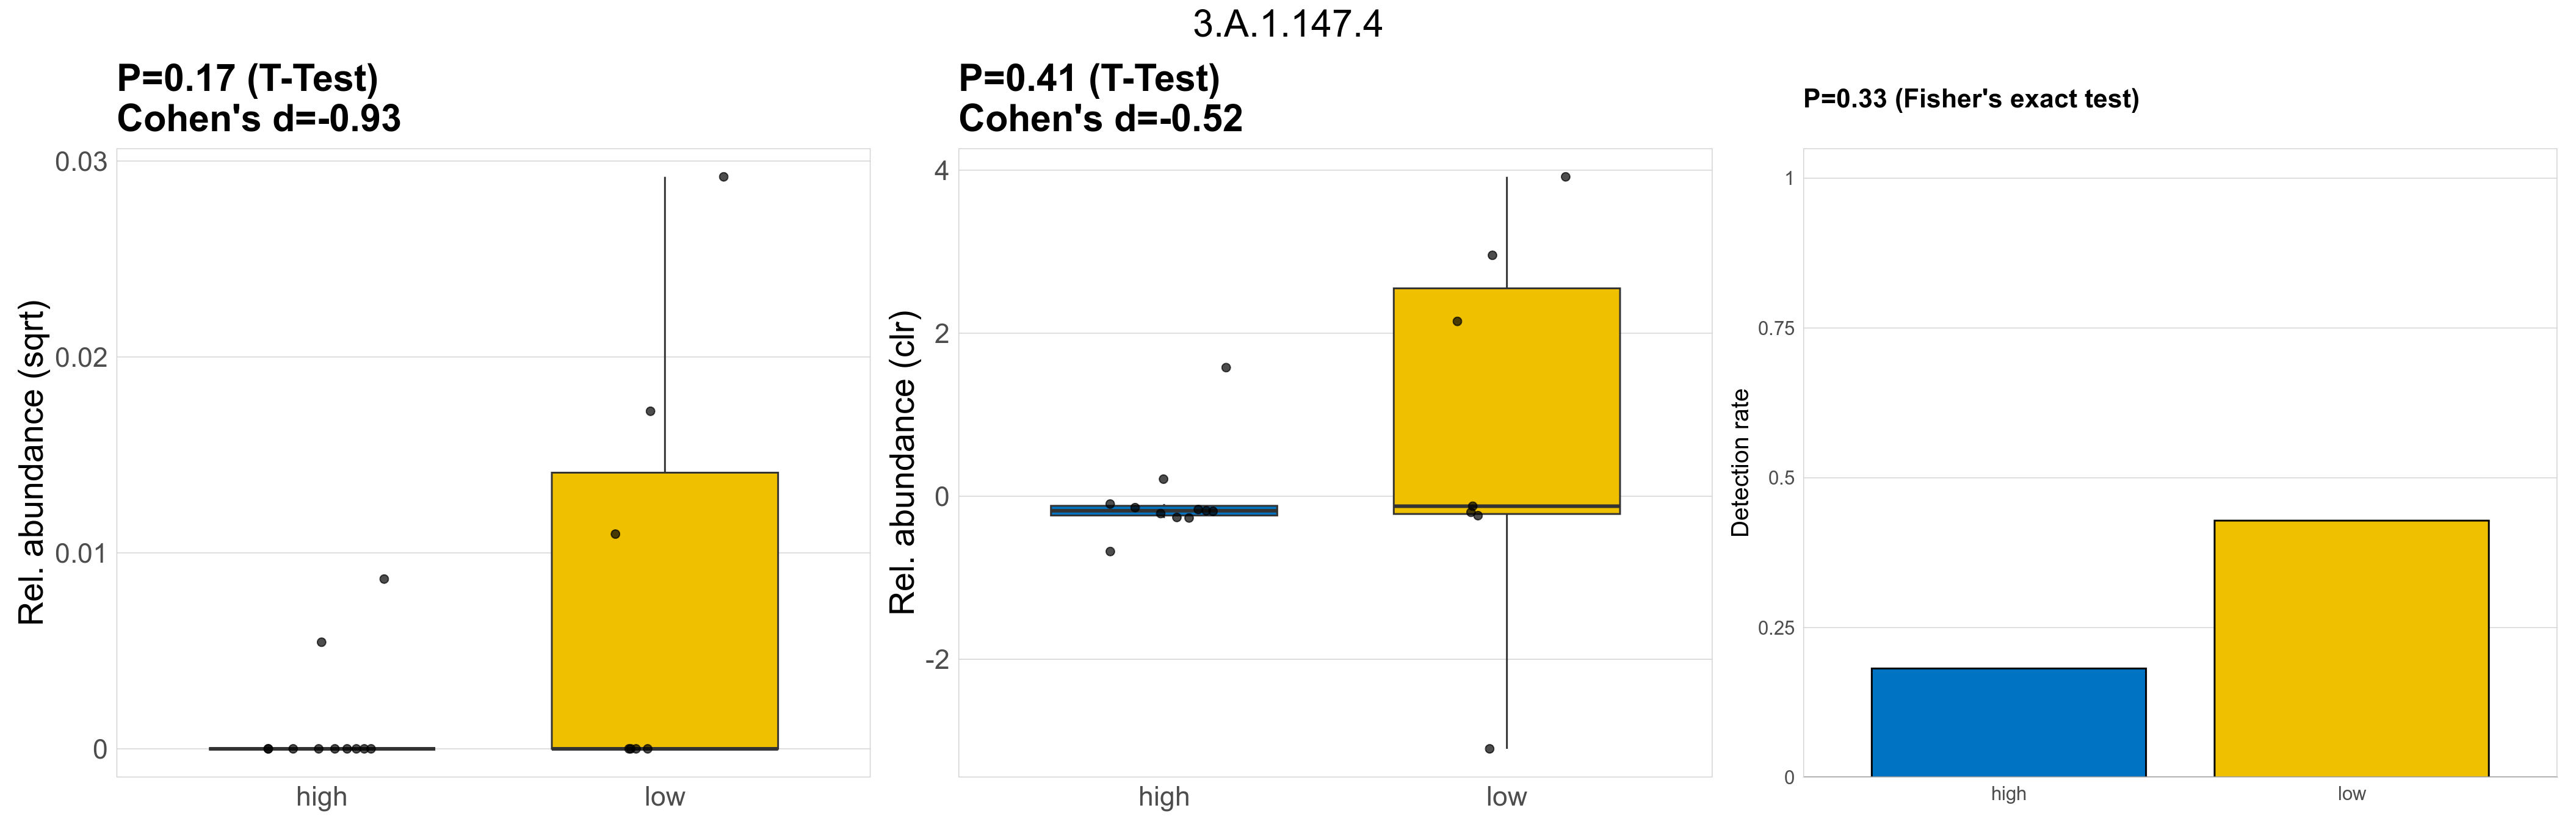
| 3.A.1.147.4 | The ATP-binding Cassette (ABC) Superfamily | 0.17 | 0.8 | 1 | -0.93 | 0.41 | 1 | 1 | -0.52 | 0.33 | 1 | 1 | 0.5 | 0.93 | 0.46 | 0.95 | 0.00027 | 7.6e-05 | 0 | 9.5e-06 | 0 | 2.3e-05 | 0.00018 | 0 | 0.00032 | 4.2 | 5 / 18 (28%) | 2 / 11 (18%) | 3 / 7 (43%) | 0.182 | 0.429 |
| 3.A.1.122.30 | The ATP-binding Cassette (ABC) Superfamily | 0.54 | 0.8 | 1 | 0.33 | 0.21 | 1 | 1 | 0.71 | 0.25 | 1 | 1 | 0.27 | 0.91 | 0.34 | 0.94 | 0.0024 | 0.0019 | 0.0017 | 0.002 | 0.0014 | 0.0017 | 0.0017 | 0.0019 | 0.0019 | -0.23 | 14 / 18 (78%) | 10 / 11 (91%) | 4 / 7 (57%) | 0.909 | 0.571 |
| 3.A.1.6.1 | The ATP-binding Cassette (ABC) Superfamily | 0.31 | 0.8 | 1 | -0.67 | 0.22 | 1 | 1 | -0.77 | 0.53 | 1 | 1 | 0.44 | 0.92 | 0.45 | 0.94 | 0.00074 | 0.00012 | 0 | 8.1e-06 | 0 | 2.7e-05 | 0.00031 | 0 | 0.00076 | 5.3 | 3 / 18 (17%) | 1 / 11 (9.1%) | 2 / 7 (29%) | 0.0909 | 0.286 |
| 1.A.43.3.1 | The Camphor Resistance or Fluoride Exporter (Fluc) Family | 0.67 | 0.81 | 1 | 0.24 | 0.28 | 1 | 1 | 0.6 | 0.25 | 1 | 1 | 0.43 | 0.93 | 0.46 | 0.95 | 0.00055 | 0.00043 | 0.00046 | 0.00042 | 4e-04 | 0.00032 | 0.00044 | 0.00059 | 0.00044 | 0.067 | 14 / 18 (78%) | 10 / 11 (91%) | 4 / 7 (57%) | 0.909 | 0.571 |
| 2.A.2.3.4 | The Glycoside-Pentoside-Hexuronide (GPH):Cation Symporter Family | 0.67 | 0.81 | 1 | -0.26 | 0.55 | 1 | 1 | 0.27 | 1 | 1 | 1 | 0.48 | 0.93 | 0.51 | 0.95 | 0.00027 | 6.1e-05 | 0 | 2e-05 | 0 | 3.9e-05 | 0.00013 | 0 | 0.00033 | 2.7 | 4 / 18 (22%) | 3 / 11 (27%) | 1 / 7 (14%) | 0.273 | 0.143 |
| 2.A.17.1.6 | The Proton-dependent Oligopeptide Transporter (POT/PTR) Family | 0.21 | 0.8 | 1 | -0.76 | 0.52 | 1 | 1 | -0.38 | 1 | 1 | 1 | 0.53 | 0.94 | 0.51 | 0.95 | 0.00014 | 7.2e-05 | 1.5e-05 | 2.8e-05 | 0 | 3.9e-05 | 0.00014 | 6.8e-05 | 0.00018 | 2.3 | 9 / 18 (50%) | 5 / 11 (45%) | 4 / 7 (57%) | 0.455 | 0.571 |
| 3.D.4.5.1 | The Proton-translocating Cytochrome Oxidase (COX) Superfamily | 0.36 | 0.8 | 1 | -0.59 | 0.42 | 1 | 1 | -0.47 | 1 | 1 | 1 | 0.48 | 0.93 | 0.49 | 0.94 | 5e-04 | 0.00011 | 0 | 1.6e-05 | 0 | 3.7e-05 | 0.00026 | 0 | 0.00063 | 4 | 4 / 18 (22%) | 2 / 11 (18%) | 2 / 7 (29%) | 0.182 | 0.286 |
| 2.A.1.7.17 | The Major Facilitator Superfamily (MFS) | 0.59 | 0.8 | 1 | 0.23 | 0.54 | 1 | 1 | 0.32 | 1 | 1 | 1 | 0.6 | 0.95 | 0.67 | 0.96 | 0.00031 | 8.7e-05 | 0 | 0.00012 | 0 | 0.00032 | 3.3e-05 | 0 | 5.6e-05 | -1.9 | 5 / 18 (28%) | 3 / 11 (27%) | 2 / 7 (29%) | 0.273 | 0.286 |
| 9.B.211.1.2 | The 10 TMS Putative Permease (10PP) Family | 0.65 | 0.81 | 1 | 0.23 | 0.53 | 1 | 1 | 0.34 | 0.63 | 1 | 1 | 0.65 | 0.95 | 0.74 | 0.98 | 0.00023 | 0.00015 | 7.1e-05 | 0.00016 | 7.5e-05 | 2e-04 | 0.00013 | 6.2e-05 | 0.00017 | -0.3 | 12 / 18 (67%) | 8 / 11 (73%) | 4 / 7 (57%) | 0.727 | 0.571 |
| 5.A.3.4.1 | The Prokaryotic Molybdopterin-containing Oxidoreductase (PMO) Family | 0.4 | 0.8 | 1 | -0.54 | 0.5 | 1 | 1 | -0.37 | 1 | 1 | 1 | 0.5 | 0.93 | 0.55 | 0.95 | 0.00058 | 0.00013 | 0 | 2.6e-05 | 0 | 6.9e-05 | 0.00029 | 0 | 0.00071 | 3.5 | 4 / 18 (22%) | 2 / 11 (18%) | 2 / 7 (29%) | 0.182 | 0.286 |
| 5.A.3.4.3 | The Prokaryotic Molybdopterin-containing Oxidoreductase (PMO) Family | 0.62 | 0.8 | 1 | -0.31 | 0.63 | 1 | 1 | 0.23 | 1 | 1 | 1 | 0.53 | 0.94 | 0.56 | 0.96 | 4e-04 | 8.9e-05 | 0 | 2.3e-05 | 0 | 4.1e-05 | 0.00019 | 0 | 0.00051 | 3 | 4 / 18 (22%) | 3 / 11 (27%) | 1 / 7 (14%) | 0.273 | 0.143 |
| 4.A.6.1.4 | The PTS Mannose-Fructose-Sorbose (Man) Family | 0.31 | 0.8 | 1 | -0.63 | 0.37 | 1 | 1 | -0.52 | 0.53 | 1 | 1 | 0.5 | 0.94 | 0.53 | 0.95 | 0.00024 | 4e-05 | 0 | 1.1e-05 | 0 | 3.6e-05 | 8.5e-05 | 0 | 0.00018 | 2.9 | 3 / 18 (17%) | 1 / 11 (9.1%) | 2 / 7 (29%) | 0.0909 | 0.286 |
| 3.D.1.9.1 | The H+ or Na+-translocating NADH Dehydrogenase (NDH) Family | 0.58 | 0.8 | 1 | -0.29 | 1 | 1 | 1 | -0.0023 | 0.53 | 1 | 1 | 0.58 | 0.94 | 0.59 | 0.96 | 0.00016 | 2.6e-05 | 0 | 2.2e-05 | 0 | 7.1e-05 | 3.4e-05 | 0 | 7.9e-05 | 0.63 | 3 / 18 (17%) | 1 / 11 (9.1%) | 2 / 7 (29%) | 0.0909 | 0.286 |
| 8.A.5.1.5 | The Voltage-gated K+ Channel β-subunit (Kvβ) Family | 0.55 | 0.8 | 1 | -0.38 | 0.99 | 1 | 1 | 0.004 | 1 | 1 | 1 | 0.49 | 0.93 | 0.51 | 0.95 | 0.00034 | 5.7e-05 | 0 | 1.3e-05 | 0 | 3.5e-05 | 0.00013 | 0 | 0.00033 | 3.3 | 3 / 18 (17%) | 2 / 11 (18%) | 1 / 7 (14%) | 0.182 | 0.143 |
| 2.A.121.1.1 | The Sulfate Transporter (CysZ) Family | 0.6 | 0.8 | 1 | -0.32 | 0.8 | 1 | 1 | 0.11 | 1 | 1 | 1 | 0.47 | 0.93 | 0.51 | 0.95 | 0.00033 | 5.5e-05 | 0 | 1.7e-05 | 0 | 3.9e-05 | 0.00012 | 0 | 0.00031 | 2.8 | 3 / 18 (17%) | 2 / 11 (18%) | 1 / 7 (14%) | 0.182 | 0.143 |
| 2.A.3.1.24 | The Amino Acid-Polyamine-Organocation (APC) Family | 0.75 | 0.85 | 1 | -0.18 | 0.34 | 1 | 1 | 0.39 | 1 | 1 | 1 | 0.48 | 0.93 | 0.51 | 0.95 | 0.00017 | 2.8e-05 | 0 | 1.6e-05 | 0 | 3.7e-05 | 4.8e-05 | 0 | 0.00013 | 1.6 | 3 / 18 (17%) | 2 / 11 (18%) | 1 / 7 (14%) | 0.182 | 0.143 |
| 3.A.1.120.6 | The ATP-binding Cassette (ABC) Superfamily | 0.54 | 0.8 | 1 | -0.38 | 1 | 1 | 1 | -0.0017 | 1 | 1 | 1 | 0.51 | 0.93 | 0.57 | 0.96 | 0.00034 | 5.7e-05 | 0 | 1.3e-05 | 0 | 3.3e-05 | 0.00013 | 0 | 0.00033 | 3.3 | 3 / 18 (17%) | 2 / 11 (18%) | 1 / 7 (14%) | 0.182 | 0.143 |
| 9.B.34.1.2 | The Kinase/Phosphatase/Cyclic-GMP Synthase/Cyclic di-GMP Hydrolase (KPSH) Family | 0.49 | 0.8 | 1 | -0.44 | 0.81 | 1 | 1 | -0.12 | 1 | 1 | 1 | 0.52 | 0.94 | 0.56 | 0.96 | 0.00042 | 7e-05 | 0 | 9.5e-06 | 0 | 2.3e-05 | 0.00016 | 0 | 0.00044 | 4.1 | 3 / 18 (17%) | 2 / 11 (18%) | 1 / 7 (14%) | 0.182 | 0.143 |
| 1.B.17.3.10 | The Outer Membrane Factor (OMF) Family | 0.58 | 0.8 | 1 | -0.34 | 0.86 | 1 | 1 | 0.08 | 1 | 1 | 1 | 0.51 | 0.93 | 0.54 | 0.95 | 0.00027 | 4.6e-05 | 0 | 1.3e-05 | 0 | 3.5e-05 | 9.7e-05 | 0 | 0.00026 | 2.9 | 3 / 18 (17%) | 2 / 11 (18%) | 1 / 7 (14%) | 0.182 | 0.143 |
| 2.A.1.2.65 | The Major Facilitator Superfamily (MFS) | 0.36 | 0.8 | 1 | -0.57 | 0.51 | 1 | 1 | -0.35 | 1 | 1 | 1 | 0.5 | 0.93 | 0.55 | 0.96 | 0.00015 | 3.4e-05 | 0 | 9.5e-06 | 0 | 2.3e-05 | 7.3e-05 | 0 | 0.00015 | 2.9 | 4 / 18 (22%) | 2 / 11 (18%) | 2 / 7 (29%) | 0.182 | 0.286 |
| 3.A.1.105.15 | The ATP-binding Cassette (ABC) Superfamily | 0.28 | 0.8 | 1 | -0.72 | 0.24 | 1 | 1 | -0.74 | 0.53 | 1 | 1 | 0.5 | 0.93 | 0.52 | 0.95 | 0.00033 | 5.5e-05 | 0 | 5.4e-06 | 0 | 1.8e-05 | 0.00013 | 0 | 3e-04 | 4.6 | 3 / 18 (17%) | 1 / 11 (9.1%) | 2 / 7 (29%) | 0.0909 | 0.286 |
| 5.A.3.4.2 | The Prokaryotic Molybdopterin-containing Oxidoreductase (PMO) Family | 0.55 | 0.8 | 1 | -0.37 | 0.93 | 1 | 1 | 0.044 | 1 | 1 | 1 | 0.5 | 0.94 | 0.55 | 0.96 | 0.00057 | 9.6e-05 | 0 | 2.1e-05 | 0 | 4.7e-05 | 0.00021 | 0 | 0.00056 | 3.3 | 3 / 18 (17%) | 2 / 11 (18%) | 1 / 7 (14%) | 0.182 | 0.143 |
| 4.A.1.1.3 | The PTS Glucose-Glucoside (Glc) Family | 0.81 | 0.88 | 1 | -0.13 | 0.47 | 1 | 1 | 0.3 | 1 | 1 | 1 | 0.46 | 0.93 | 0.52 | 0.95 | 0.00031 | 5.2e-05 | 0 | 3.6e-05 | 0 | 1e-04 | 7.7e-05 | 0 | 2e-04 | 1.1 | 3 / 18 (17%) | 2 / 11 (18%) | 1 / 7 (14%) | 0.182 | 0.143 |
| 3.A.1.21.1 | The ATP-binding Cassette (ABC) Superfamily | 0.5 | 0.8 | 1 | -0.43 | 0.83 | 1 | 1 | -0.11 | 1 | 1 | 1 | 0.52 | 0.94 | 0.52 | 0.95 | 0.00052 | 8.7e-05 | 0 | 1.3e-05 | 0 | 3.5e-05 | 2e-04 | 0 | 0.00054 | 3.9 | 3 / 18 (17%) | 2 / 11 (18%) | 1 / 7 (14%) | 0.182 | 0.143 |
| 2.A.1.3.17 | The Major Facilitator Superfamily (MFS) | 0.6 | 0.8 | 1 | -0.32 | 0.76 | 1 | 1 | 0.14 | 1 | 1 | 1 | 0.48 | 0.93 | 0.54 | 0.96 | 0.00031 | 5.1e-05 | 0 | 1.6e-05 | 0 | 3.7e-05 | 0.00011 | 0 | 0.00028 | 2.8 | 3 / 18 (17%) | 2 / 11 (18%) | 1 / 7 (14%) | 0.182 | 0.143 |
| 1.A.16.3.1 | The Formate-Nitrite Transporter (FNT) Family | 0.61 | 0.8 | 1 | -0.31 | 0.73 | 1 | 1 | 0.15 | 1 | 1 | 1 | 0.49 | 0.93 | 0.53 | 0.95 | 0.00023 | 3.8e-05 | 0 | 1.3e-05 | 0 | 3.5e-05 | 7.7e-05 | 0 | 2e-04 | 2.6 | 3 / 18 (17%) | 2 / 11 (18%) | 1 / 7 (14%) | 0.182 | 0.143 |
| 1.B.1.1.1 | The General Bacterial Porin (GBP) Family | 0.78 | 0.88 | 1 | -0.16 | 0.35 | 1 | 1 | 0.39 | 1 | 1 | 1 | 0.51 | 0.94 | 0.55 | 0.96 | 0.00021 | 3.5e-05 | 0 | 2.1e-05 | 0 | 4.7e-05 | 5.8e-05 | 0 | 0.00015 | 1.5 | 3 / 18 (17%) | 2 / 11 (18%) | 1 / 7 (14%) | 0.182 | 0.143 |
| 3.A.1.2.2 | The ATP-binding Cassette (ABC) Superfamily | 0.6 | 0.8 | 1 | -0.32 | 0.81 | 1 | 1 | 0.11 | 1 | 1 | 1 | 0.49 | 0.93 | 0.51 | 0.95 | 0.00058 | 9.7e-05 | 0 | 2.9e-05 | 0 | 6.8e-05 | 2e-04 | 0 | 0.00054 | 2.8 | 3 / 18 (17%) | 2 / 11 (18%) | 1 / 7 (14%) | 0.182 | 0.143 |
| 3.A.2.1.1 | The H+- or Na+-translocating F-type. V-type and A-type ATPase (F-ATPase) Superfamily | 0.43 | 0.8 | 1 | -0.51 | 0.67 | 1 | 1 | -0.24 | 1 | 1 | 1 | 0.52 | 0.93 | 0.55 | 0.96 | 0.00087 | 0.00024 | 0 | 3.1e-05 | 0 | 5.5e-05 | 0.00058 | 0 | 0.0015 | 4.2 | 5 / 18 (28%) | 3 / 11 (27%) | 2 / 7 (29%) | 0.273 | 0.286 |
| 3.A.1.3.26 | The ATP-binding Cassette (ABC) Superfamily | 0.32 | 0.8 | 1 | -0.65 | 0.24 | 1 | 1 | -0.72 | 0.53 | 1 | 1 | 0.5 | 0.94 | 0.49 | 0.95 | 0.00077 | 0.00013 | 0 | 1.1e-05 | 0 | 3.6e-05 | 0.00032 | 0 | 0.00079 | 4.9 | 3 / 18 (17%) | 1 / 11 (9.1%) | 2 / 7 (29%) | 0.0909 | 0.286 |
| 2.A.1.33.2 | The Major Facilitator Superfamily (MFS) | 0.93 | 0.96 | 1 | -0.046 | 0.81 | 1 | 1 | 0.13 | 1 | 1 | 1 | 0.63 | 0.95 | 0.64 | 0.97 | 0.00041 | 0.00011 | 0 | 0.00011 | 0 | 0.00029 | 0.00012 | 0 | 0.00028 | 0.13 | 5 / 18 (28%) | 3 / 11 (27%) | 2 / 7 (29%) | 0.273 | 0.286 |
| 1.A.23.4.5 | The Small Conductance Mechanosensitive Ion Channel (MscS) Family | 0.52 | 0.8 | 1 | -0.38 | 0.9 | 1 | 1 | -0.053 | 1 | 1 | 1 | 0.48 | 0.93 | 0.55 | 0.96 | 0.00021 | 4.7e-05 | 0 | 1.8e-05 | 0 | 4.5e-05 | 9.1e-05 | 0 | 0.00023 | 2.3 | 4 / 18 (22%) | 2 / 11 (18%) | 2 / 7 (29%) | 0.182 | 0.286 |
| 3.A.1.25.6 | The ATP-binding Cassette (ABC) Superfamily | 0.69 | 0.83 | 1 | -0.22 | 0.86 | 1 | 1 | 0.098 | 1 | 1 | 1 | 0.71 | 0.96 | 0.79 | 0.98 | 0.00051 | 0.00031 | 0.00023 | 0.00022 | 0.00022 | 0.00022 | 0.00046 | 0.00024 | 8e-04 | 1.1 | 11 / 18 (61%) | 7 / 11 (64%) | 4 / 7 (57%) | 0.636 | 0.571 |
| 3.A.1.129.1 | The ATP-binding Cassette (ABC) Superfamily | 0.48 | 0.8 | 1 | -0.45 | 0.82 | 1 | 1 | -0.12 | 1 | 1 | 1 | 0.52 | 0.93 | 0.55 | 0.96 | 0.00041 | 0.00012 | 0 | 2e-05 | 0 | 3.9e-05 | 0.00027 | 0 | 0.00069 | 3.8 | 5 / 18 (28%) | 3 / 11 (27%) | 2 / 7 (29%) | 0.273 | 0.286 |
| 2.A.1.2.60 | The Major Facilitator Superfamily (MFS) | 0.25 | 0.8 | 1 | -0.76 | 0.21 | 1 | 1 | -0.83 | 0.53 | 1 | 1 | 0.48 | 0.92 | 0.52 | 0.94 | 2e-04 | 3.4e-05 | 0 | 2.7e-06 | 0 | 8.9e-06 | 8.3e-05 | 0 | 0.00018 | 4.9 | 3 / 18 (17%) | 1 / 11 (9.1%) | 2 / 7 (29%) | 0.0909 | 0.286 |
| 9.B.226.1.8 | The Uncharacterized 9 or 10 TMS Protein (U-TMP) Family | 0.61 | 0.8 | 1 | 0.27 | 0.31 | 1 | 1 | 0.55 | 0.25 | 1 | 1 | 0.42 | 0.93 | 0.44 | 0.95 | 0.00098 | 0.00076 | 7e-04 | 0.00082 | 0.00044 | 0.00079 | 0.00068 | 0.00096 | 0.00065 | -0.27 | 14 / 18 (78%) | 10 / 11 (91%) | 4 / 7 (57%) | 0.909 | 0.571 |
| 9.B.22.1.8 | The Leukotoxin Secretion Morphogenesis Protein C (MorC) Family | 0.37 | 0.8 | 1 | -0.49 | 0.51 | 1 | 1 | -0.36 | 0.33 | 1 | 1 | 0.56 | 0.94 | 0.61 | 0.97 | 0.0011 | 0.00031 | 0 | 0.00019 | 0 | 0.00053 | 0.00049 | 0 | 0.00089 | 1.4 | 5 / 18 (28%) | 2 / 11 (18%) | 3 / 7 (43%) | 0.182 | 0.429 |
| 1.B.75.1.3 | The DUF481 Putative Beta Barrel Porin (DUF481) Family | 0.25 | 0.8 | 1 | -0.77 | 0.21 | 1 | 1 | -0.83 | 0.53 | 1 | 1 | 0.47 | 0.92 | 0.53 | 0.94 | 0.00023 | 3.8e-05 | 0 | 2.7e-06 | 0 | 8.9e-06 | 9.4e-05 | 0 | 2e-04 | 5.1 | 3 / 18 (17%) | 1 / 11 (9.1%) | 2 / 7 (29%) | 0.0909 | 0.286 |
| 2.A.40.4.3 | The Nucleobase/Ascorbate Transporter (NAT) or Nucleobase:Cation Symporter-2 (NCS2) Family | 0.28 | 0.8 | 1 | -0.69 | 0.35 | 1 | 1 | -0.53 | 0.53 | 1 | 1 | 0.41 | 0.92 | 0.45 | 0.95 | 0.00027 | 4.4e-05 | 0 | 1e-05 | 0 | 3.4e-05 | 9.8e-05 | 0 | 0.00018 | 3.3 | 3 / 18 (17%) | 1 / 11 (9.1%) | 2 / 7 (29%) | 0.0909 | 0.286 |
| 2.A.1.4.3 | The Major Facilitator Superfamily (MFS) | 0.55 | 0.8 | 1 | -0.38 | 0.96 | 1 | 1 | 0.022 | 1 | 1 | 1 | 0.5 | 0.94 | 0.55 | 0.96 | 0.00034 | 5.6e-05 | 0 | 1.2e-05 | 0 | 2.6e-05 | 0.00013 | 0 | 0.00033 | 3.4 | 3 / 18 (17%) | 2 / 11 (18%) | 1 / 7 (14%) | 0.182 | 0.143 |
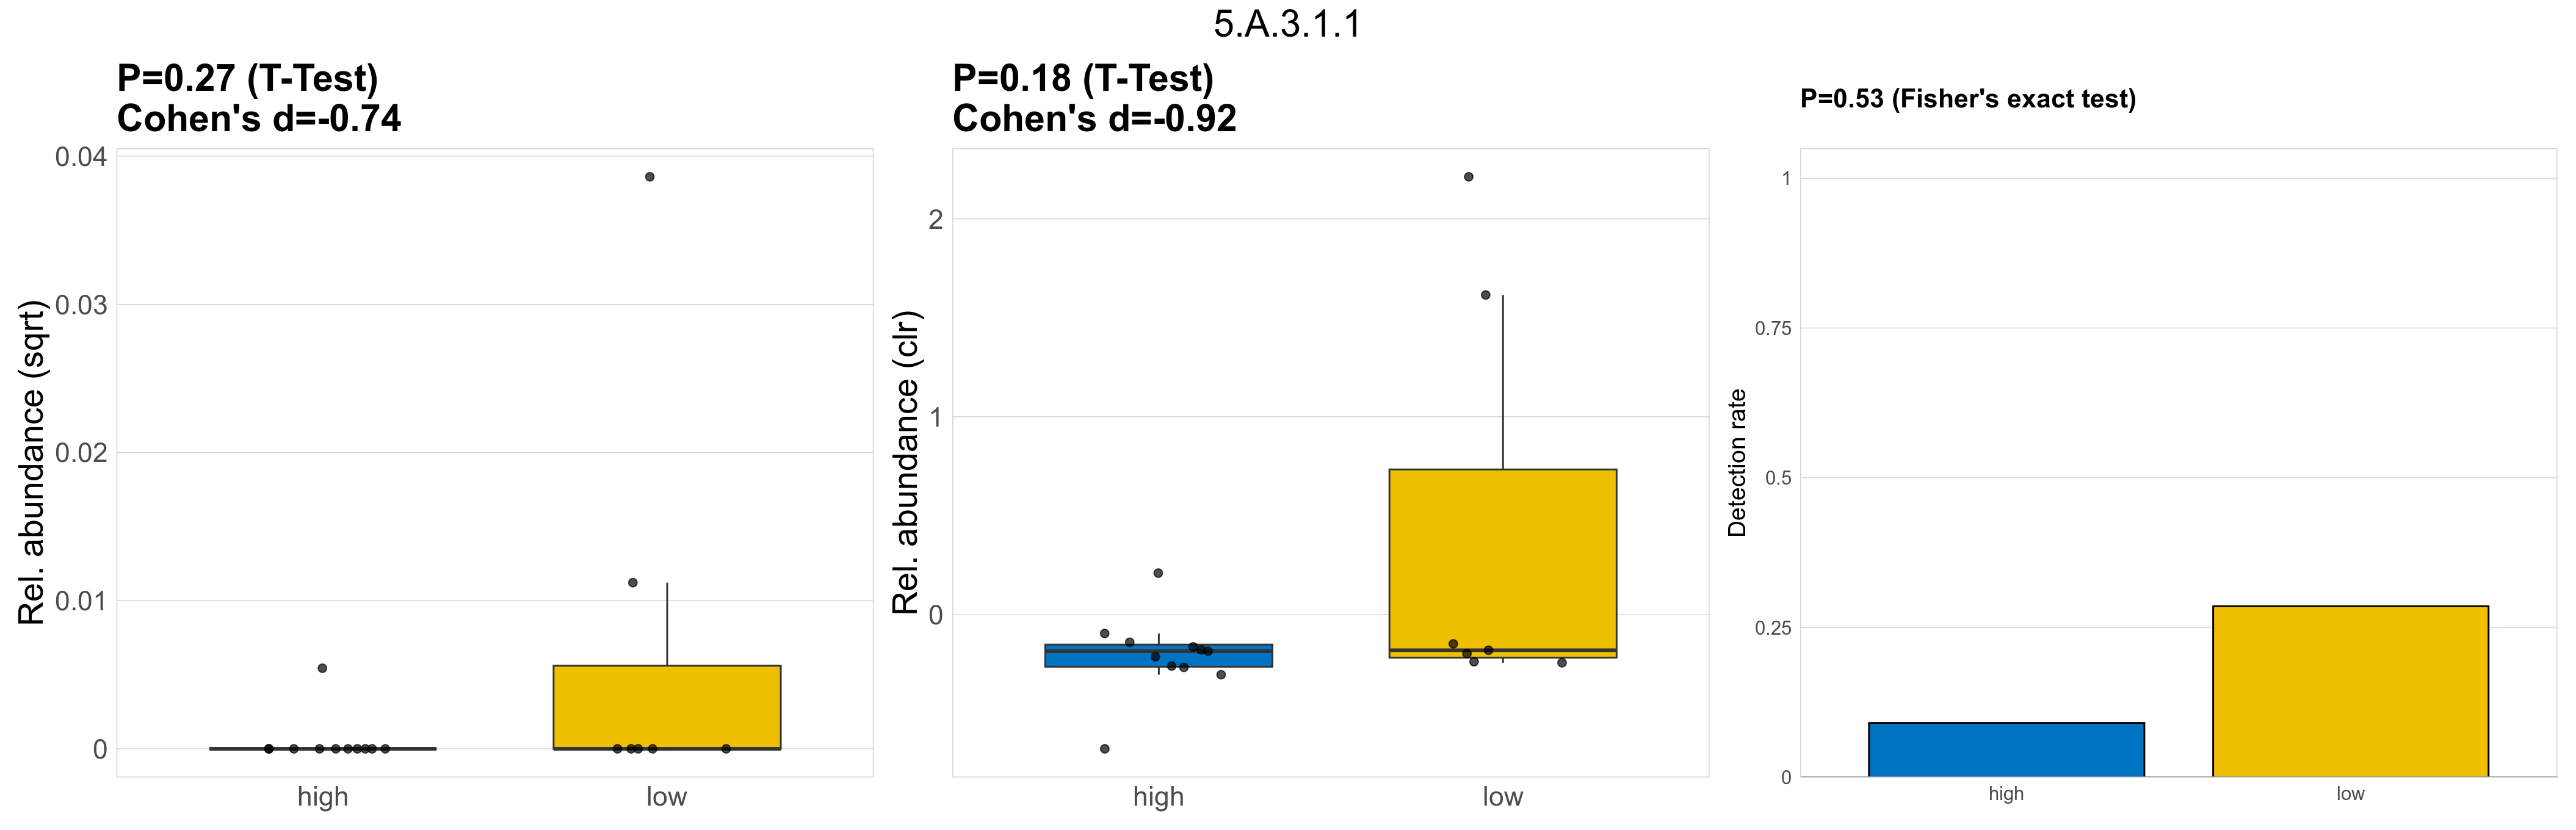
| 5.A.3.1.1 | The Prokaryotic Molybdopterin-containing Oxidoreductase (PMO) Family | 0.27 | 0.8 | 1 | -0.74 | 0.18 | 1 | 1 | -0.92 | 0.53 | 1 | 1 | 0.39 | 0.9 | 0.39 | 0.93 | 0.00055 | 9.1e-05 | 0 | 2.7e-06 | 0 | 8.9e-06 | 0.00023 | 0 | 0.00056 | 6.4 | 3 / 18 (17%) | 1 / 11 (9.1%) | 2 / 7 (29%) | 0.0909 | 0.286 |
| 2.A.17.1.2 | The Proton-dependent Oligopeptide Transporter (POT/PTR) Family | 0.8 | 0.88 | 1 | -0.14 | 0.25 | 1 | 1 | 0.46 | 1 | 1 | 1 | 0.5 | 0.93 | 0.53 | 0.95 | 0.00015 | 2.5e-05 | 0 | 1.6e-05 | 0 | 3.7e-05 | 3.9e-05 | 0 | 1e-04 | 1.3 | 3 / 18 (17%) | 2 / 11 (18%) | 1 / 7 (14%) | 0.182 | 0.143 |
| 3.A.1.125.1 | The ATP-binding Cassette (ABC) Superfamily | 0.58 | 0.8 | 1 | -0.34 | 0.85 | 1 | 1 | 0.088 | 1 | 1 | 1 | 0.53 | 0.93 | 0.54 | 0.96 | 0.00038 | 6.3e-05 | 0 | 1.7e-05 | 0 | 4e-05 | 0.00014 | 0 | 0.00036 | 3 | 3 / 18 (17%) | 2 / 11 (18%) | 1 / 7 (14%) | 0.182 | 0.143 |
| 3.A.1.5.42 | The ATP-binding Cassette (ABC) Superfamily | 0.38 | 0.8 | 1 | -0.57 | 0.33 | 1 | 1 | -0.53 | 0.53 | 1 | 1 | 0.49 | 0.93 | 0.52 | 0.95 | 0.00045 | 7.6e-05 | 0 | 1.1e-05 | 0 | 3.6e-05 | 0.00018 | 0 | 0.00046 | 4 | 3 / 18 (17%) | 1 / 11 (9.1%) | 2 / 7 (29%) | 0.0909 | 0.286 |
| 9.B.186.1.1 | The Putative Lipoprotein Supressor of a ts bamD mutant. YiaD (YiaD) Family | 0.33 | 0.8 | 1 | -0.59 | 0.49 | 1 | 1 | -0.37 | 0.53 | 1 | 1 | 0.53 | 0.94 | 0.58 | 0.96 | 0.00016 | 2.7e-05 | 0 | 1e-05 | 0 | 3.4e-05 | 5.4e-05 | 0 | 1e-04 | 2.4 | 3 / 18 (17%) | 1 / 11 (9.1%) | 2 / 7 (29%) | 0.0909 | 0.286 |
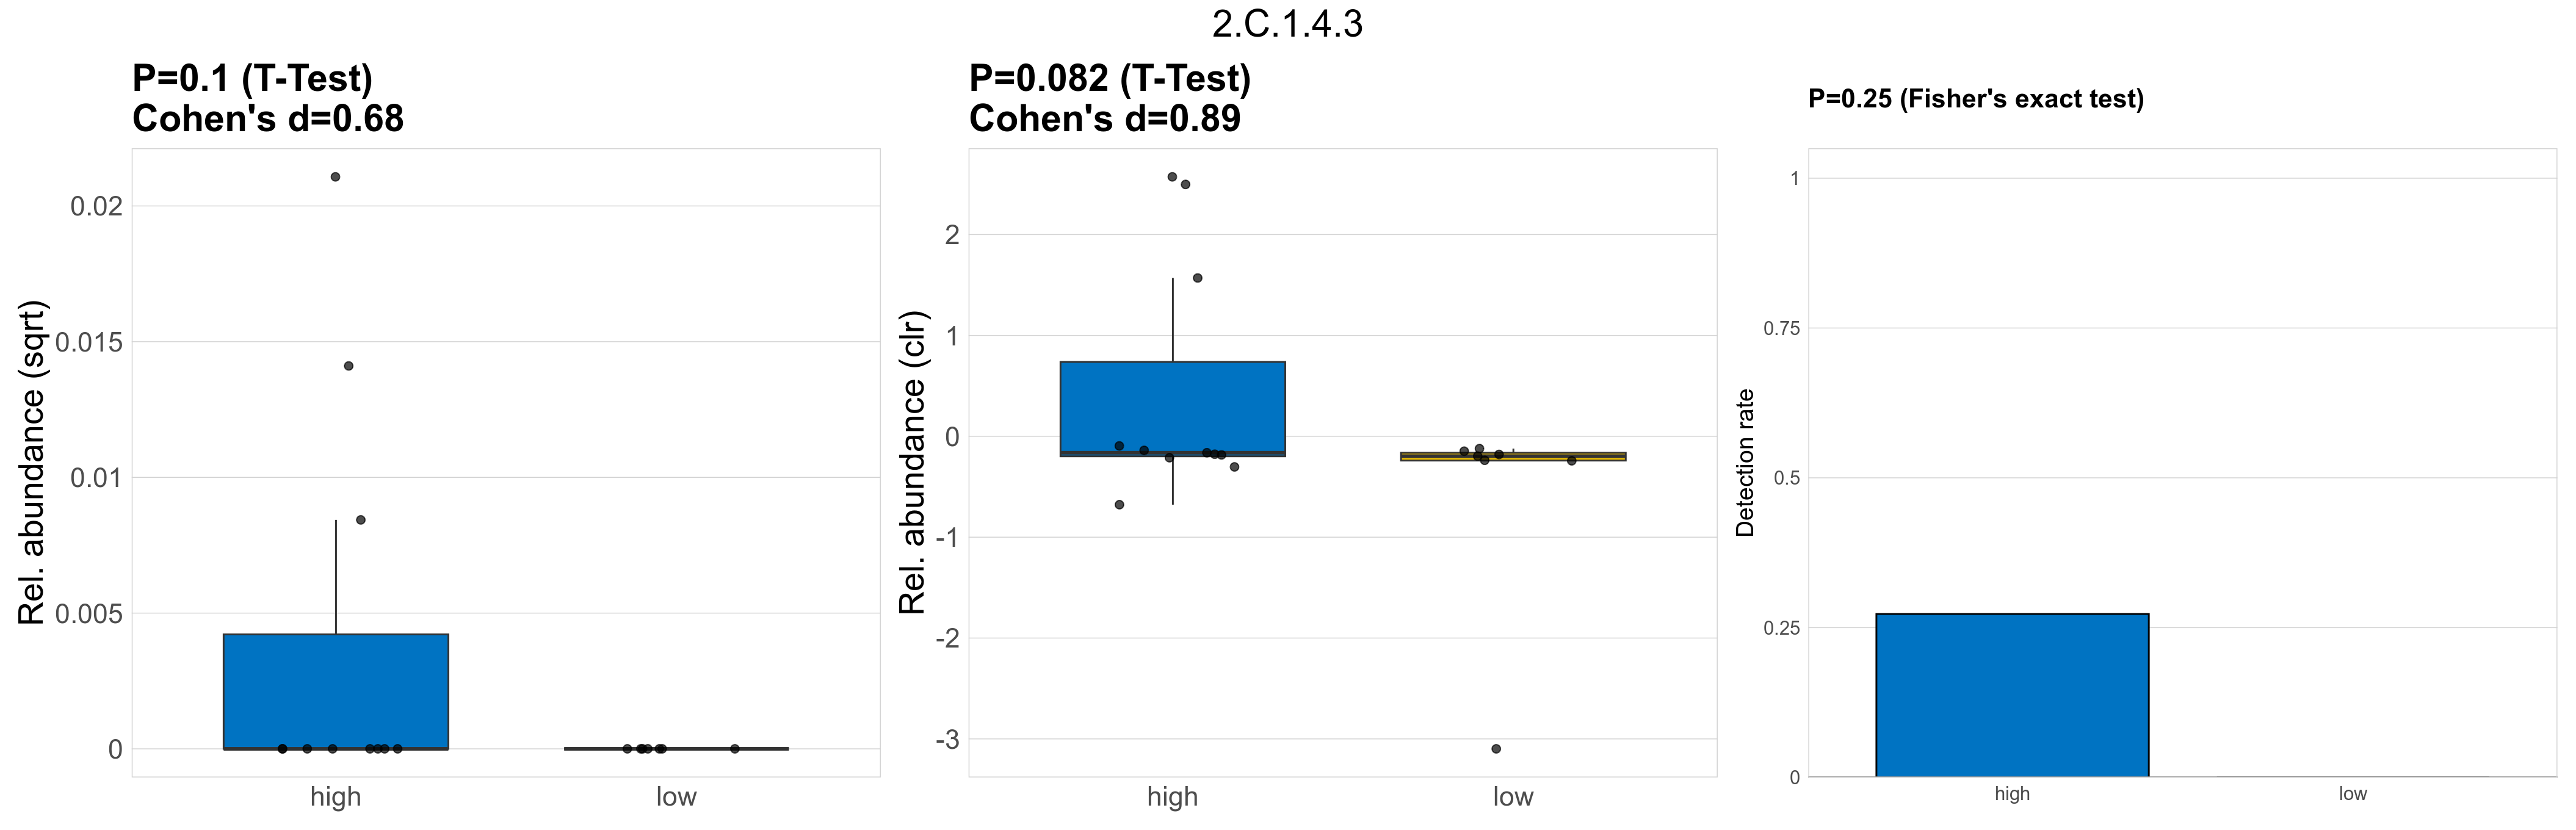
| 2.C.1.4.3 | The TonB-ExbB-ExbD/TolA-TolQ-TolR Outer Membrane Receptor Energizers and Stabilizers (TonB/TolA) Family | 0.1 | 0.8 | 1 | 0.68 | 0.082 | 1 | 1 | 0.89 | 0.25 | 1 | 1 | 0.38 | 0.92 | 0.4 | 0.94 | 0.00024 | 4e-05 | 0 | 6.5e-05 | 0 | 0.00014 | 0 | 0 | 0 | -Inf | 3 / 18 (17%) | 3 / 11 (27%) | 0 / 7 (0%) | 0.273 | 0 |
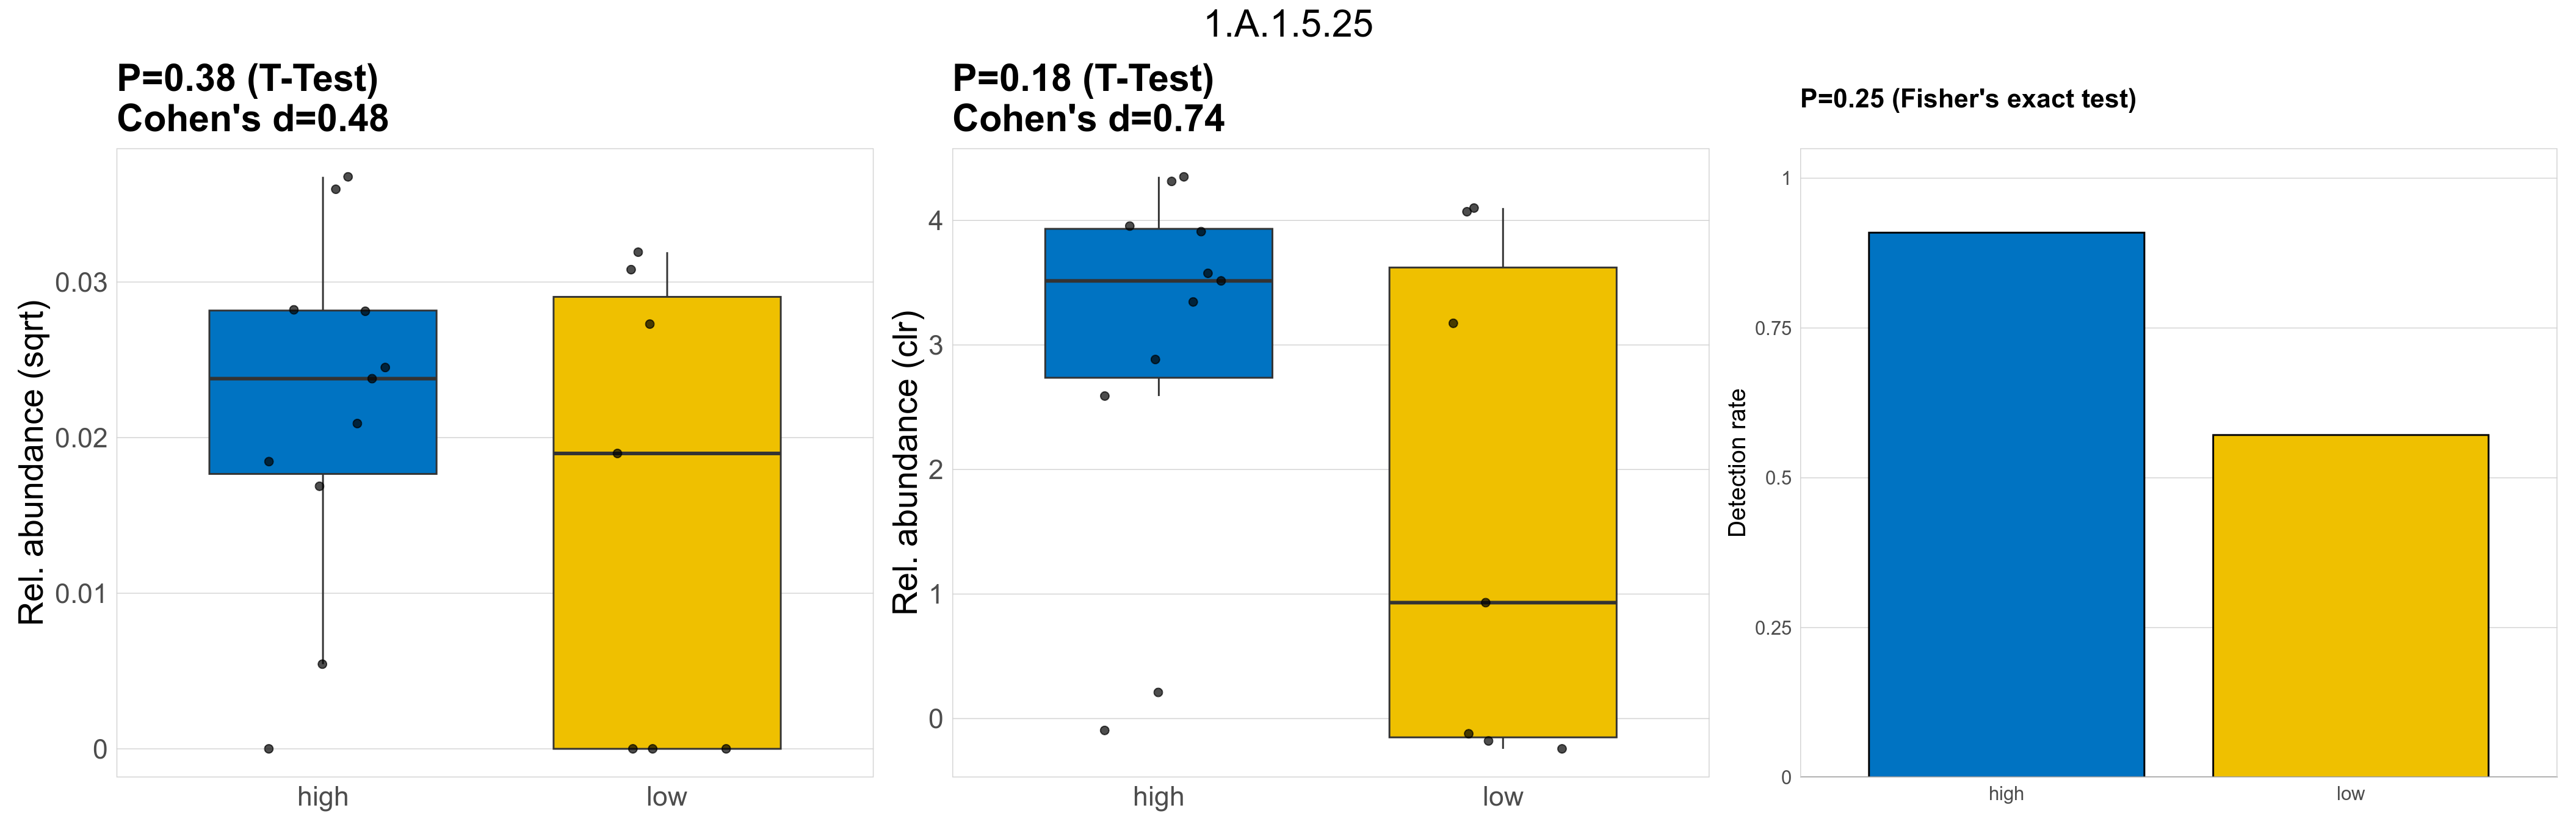
| 1.A.1.5.25 | The Voltage-gated Ion Channel (VIC) Superfamily | 0.38 | 0.8 | 1 | 0.48 | 0.18 | 1 | 1 | 0.74 | 0.25 | 1 | 1 | 0.32 | 0.91 | 0.31 | 0.94 | 0.00068 | 0.00053 | 5e-04 | 0.00059 | 0.00057 | 0.00045 | 0.00044 | 0.00036 | 0.00046 | -0.42 | 14 / 18 (78%) | 10 / 11 (91%) | 4 / 7 (57%) | 0.909 | 0.571 |
| 3.A.1.27.3 | The ATP-binding Cassette (ABC) Superfamily | 0.31 | 0.8 | 1 | -0.67 | 0.27 | 1 | 1 | -0.67 | 0.53 | 1 | 1 | 0.39 | 0.92 | 0.41 | 0.94 | 0.0011 | 0.00018 | 0 | 1.9e-05 | 0 | 6.2e-05 | 0.00044 | 0 | 0.0011 | 4.5 | 3 / 18 (17%) | 1 / 11 (9.1%) | 2 / 7 (29%) | 0.0909 | 0.286 |
| 2.A.47.3.2 | The Divalent Anion:Na+ Symporter (DASS) Family | 0.7 | 0.83 | 1 | -0.22 | 0.61 | 1 | 1 | 0.21 | 1 | 1 | 1 | 0.52 | 0.93 | 0.54 | 0.95 | 0.00027 | 4.4e-05 | 0 | 2.3e-05 | 0 | 6.8e-05 | 7.7e-05 | 0 | 2e-04 | 1.7 | 3 / 18 (17%) | 2 / 11 (18%) | 1 / 7 (14%) | 0.182 | 0.143 |
| 9.B.118.1.1 | The 11 or 12 TMS YhfT (YhfT) Family | 0.6 | 0.8 | 1 | -0.32 | 0.76 | 1 | 1 | 0.14 | 1 | 1 | 1 | 0.46 | 0.93 | 0.5 | 0.95 | 0.00031 | 5.1e-05 | 0 | 1.6e-05 | 0 | 3.7e-05 | 0.00011 | 0 | 0.00028 | 2.8 | 3 / 18 (17%) | 2 / 11 (18%) | 1 / 7 (14%) | 0.182 | 0.143 |
| 4.A.6.1.7 | The PTS Mannose-Fructose-Sorbose (Man) Family | 0.42 | 0.8 | 1 | -0.41 | 0.71 | 1 | 1 | -0.19 | 1 | 1 | 1 | 0.67 | 0.96 | 0.75 | 0.97 | 0.00026 | 0.00021 | 0.00012 | 0.00017 | 8.8e-05 | 0.00021 | 0.00026 | 0.00013 | 0.00029 | 0.61 | 14 / 18 (78%) | 8 / 11 (73%) | 6 / 7 (86%) | 0.727 | 0.857 |
| 2.A.1.7.18 | The Major Facilitator Superfamily (MFS) | 0.85 | 0.92 | 1 | -0.092 | 0.87 | 1 | 1 | 0.089 | 1 | 1 | 1 | 0.64 | 0.95 | 0.67 | 0.97 | 0.00025 | 0.00013 | 1.3e-05 | 0.00012 | 0 | 0.00029 | 0.00013 | 2.7e-05 | 0.00024 | 0.12 | 9 / 18 (50%) | 5 / 11 (45%) | 4 / 7 (57%) | 0.455 | 0.571 |
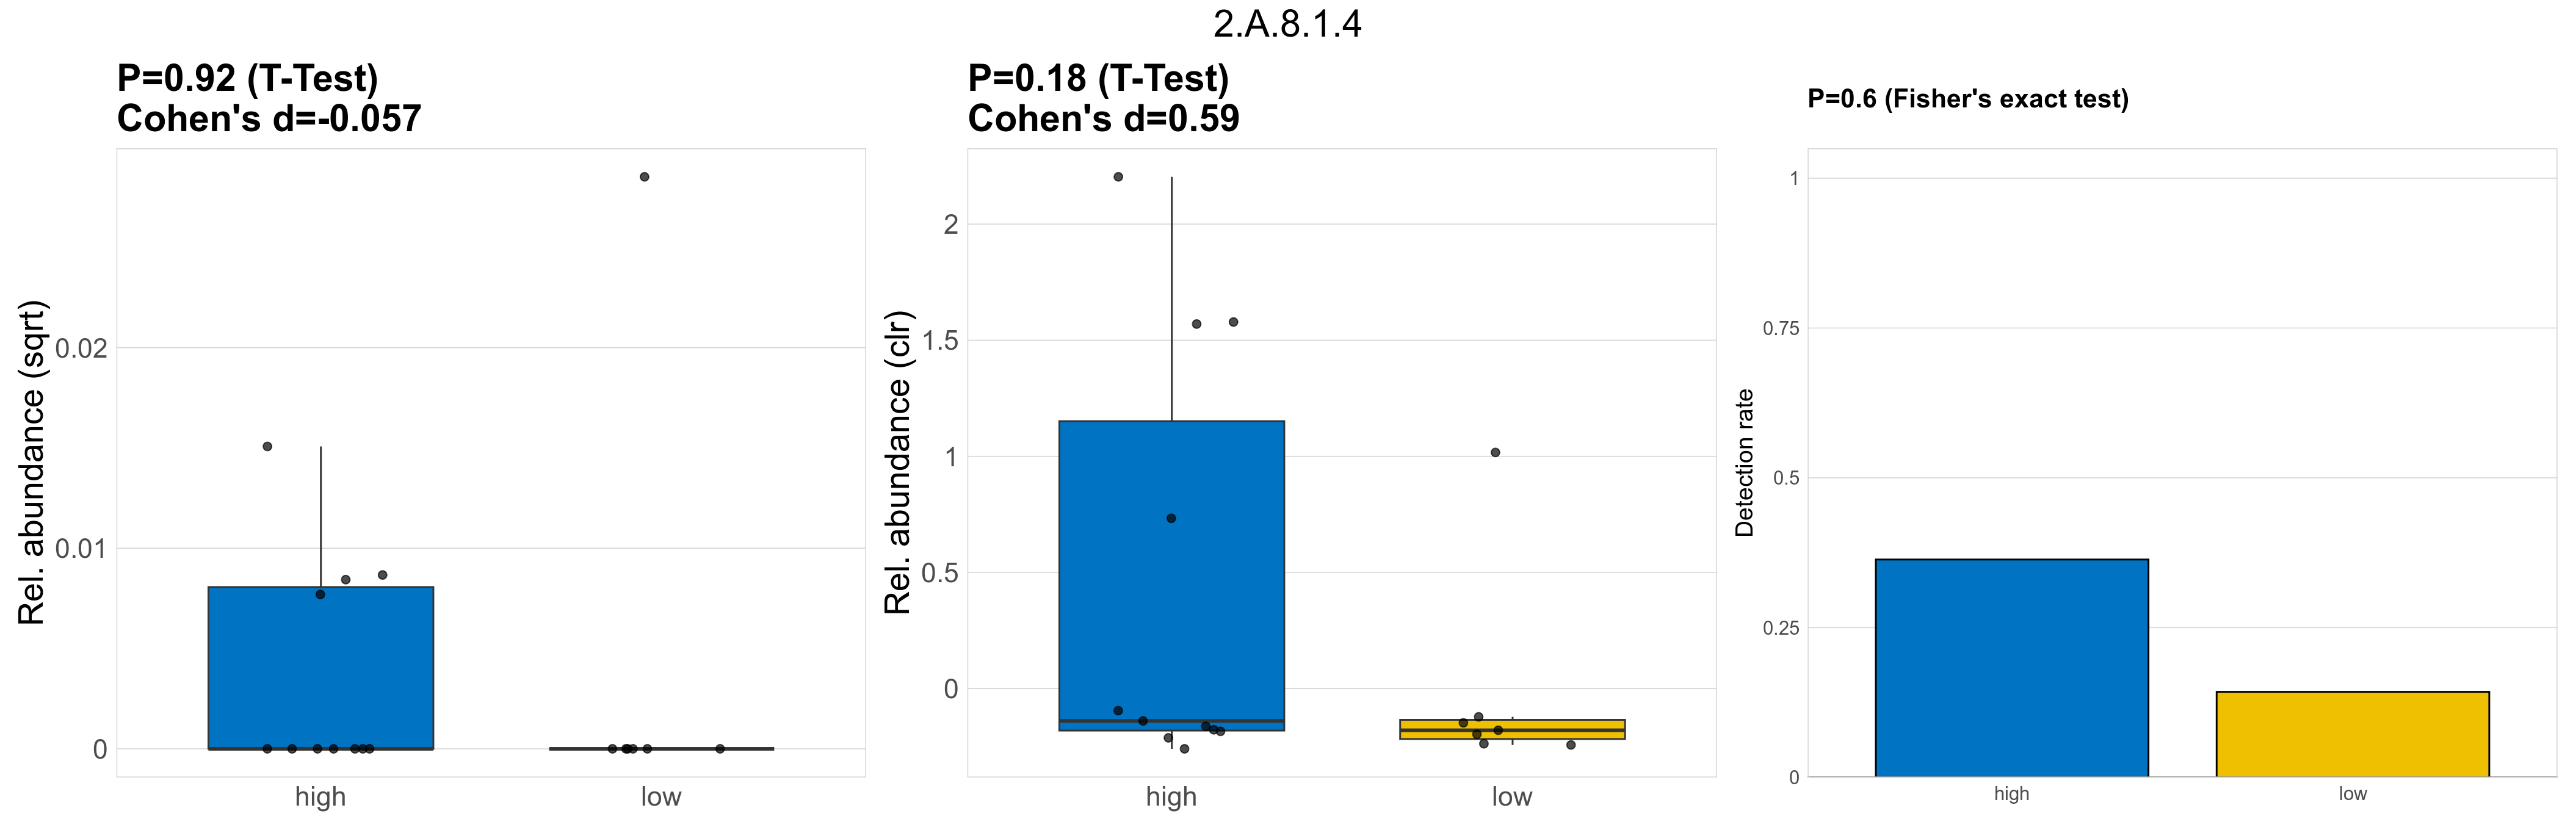
| 2.A.8.1.4 | The Gluconate:H+ Symporter (GntP) Family | 0.92 | 0.96 | 1 | -0.057 | 0.18 | 1 | 1 | 0.59 | 0.6 | 1 | 1 | 0.51 | 0.93 | 0.54 | 0.96 | 0.00025 | 6.9e-05 | 0 | 3.9e-05 | 0 | 7e-05 | 0.00012 | 0 | 0.00031 | 1.6 | 5 / 18 (28%) | 4 / 11 (36%) | 1 / 7 (14%) | 0.364 | 0.143 |
| 2.A.69.4.6 | The Auxin Efflux Carrier (AEC) Family | 0.44 | 0.8 | 1 | 0.41 | 0.2 | 1 | 1 | 0.71 | 0.25 | 1 | 1 | 0.33 | 0.91 | 0.32 | 0.94 | 0.001 | 0.00081 | 0.00078 | 0.00089 | 0.00091 | 0.00075 | 0.00068 | 0.00036 | 0.00076 | -0.39 | 14 / 18 (78%) | 10 / 11 (91%) | 4 / 7 (57%) | 0.909 | 0.571 |
| 3.A.1.23.1 | The ATP-binding Cassette (ABC) Superfamily | 0.33 | 0.8 | 1 | -0.55 | 0.68 | 1 | 1 | -0.23 | 1 | 1 | 1 | 0.56 | 0.94 | 0.62 | 0.96 | 0.00028 | 0.00015 | 3.1e-05 | 9.1e-05 | 2.9e-05 | 0.00013 | 0.00025 | 0.00014 | 3e-04 | 1.5 | 10 / 18 (56%) | 6 / 11 (55%) | 4 / 7 (57%) | 0.545 | 0.571 |
| 9.B.157.1.3 | The Cell Shape-determining MreBCD (MreBCD) Family | 0.53 | 0.8 | 1 | -0.4 | 0.94 | 1 | 1 | -0.036 | 1 | 1 | 1 | 0.51 | 0.93 | 0.54 | 0.95 | 0.00046 | 7.7e-05 | 0 | 1.6e-05 | 0 | 4.3e-05 | 0.00017 | 0 | 0.00046 | 3.4 | 3 / 18 (17%) | 2 / 11 (18%) | 1 / 7 (14%) | 0.182 | 0.143 |
| 2.A.40.3.3 | The Nucleobase/Ascorbate Transporter (NAT) or Nucleobase:Cation Symporter-2 (NCS2) Family | 0.31 | 0.8 | 1 | -0.66 | 0.27 | 1 | 1 | -0.63 | 0.53 | 1 | 1 | 0.45 | 0.92 | 0.5 | 0.94 | 0.00048 | 8.1e-05 | 0 | 1e-05 | 0 | 3.4e-05 | 0.00019 | 0 | 0.00046 | 4.2 | 3 / 18 (17%) | 1 / 11 (9.1%) | 2 / 7 (29%) | 0.0909 | 0.286 |
| 1.B.33.1.3 | The Outer Membrane Protein Insertion Porin (Bam Complex) (OmpIP) Family | 0.51 | 0.8 | 1 | -0.43 | 0.94 | 1 | 1 | 0.036 | 0.64 | 1 | 1 | 0.52 | 0.93 | 0.58 | 0.96 | 0.00064 | 0.00025 | 0 | 3.9e-05 | 0 | 5.3e-05 | 0.00058 | 0 | 0.0015 | 3.9 | 7 / 18 (39%) | 5 / 11 (45%) | 2 / 7 (29%) | 0.455 | 0.286 |
| 3.A.1.17.1 | The ATP-binding Cassette (ABC) Superfamily | 0.66 | 0.81 | 1 | -0.26 | 0.55 | 1 | 1 | 0.25 | 1 | 1 | 1 | 0.48 | 0.93 | 0.54 | 0.95 | 0.00018 | 3.1e-05 | 0 | 1.3e-05 | 0 | 3.5e-05 | 5.8e-05 | 0 | 0.00015 | 2.2 | 3 / 18 (17%) | 2 / 11 (18%) | 1 / 7 (14%) | 0.182 | 0.143 |
| 2.A.6.2.1 | The Resistance-Nodulation-Cell Division (RND) Superfamily | 0.5 | 0.8 | 1 | -0.43 | 0.88 | 1 | 1 | -0.077 | 1 | 1 | 1 | 0.5 | 0.93 | 0.49 | 0.95 | 0.00084 | 0.00014 | 0 | 1.8e-05 | 0 | 4.1e-05 | 0.00033 | 0 | 0.00087 | 4.2 | 3 / 18 (17%) | 2 / 11 (18%) | 1 / 7 (14%) | 0.182 | 0.143 |
| 1.B.55.3.1 | The Poly Acetyl Glucosamine Porin (PgaA) Family | 0.52 | 0.8 | 1 | -0.41 | 0.95 | 1 | 1 | -0.033 | 1 | 1 | 1 | 0.5 | 0.93 | 0.53 | 0.96 | 0.00068 | 0.00011 | 0 | 1.8e-05 | 0 | 4.1e-05 | 0.00026 | 0 | 0.00069 | 3.9 | 3 / 18 (17%) | 2 / 11 (18%) | 1 / 7 (14%) | 0.182 | 0.143 |
| 1.B.14.1.4 | The Outer Membrane Receptor (OMR) Family | 0.57 | 0.8 | 1 | -0.35 | 0.88 | 1 | 1 | 0.07 | 1 | 1 | 1 | 0.5 | 0.93 | 0.55 | 0.96 | 0.00037 | 6.2e-05 | 0 | 1.6e-05 | 0 | 3.7e-05 | 0.00014 | 0 | 0.00036 | 3.1 | 3 / 18 (17%) | 2 / 11 (18%) | 1 / 7 (14%) | 0.182 | 0.143 |
| 2.A.27.1.1 | The Glutamate:Na+ Symporter (ESS) Family | 0.53 | 0.8 | 1 | -0.39 | 0.99 | 1 | 1 | -0.0065 | 1 | 1 | 1 | 0.5 | 0.94 | 0.53 | 0.95 | 0.00049 | 8.1e-05 | 0 | 1.6e-05 | 0 | 3.7e-05 | 0.00018 | 0 | 0.00049 | 3.5 | 3 / 18 (17%) | 2 / 11 (18%) | 1 / 7 (14%) | 0.182 | 0.143 |
| 3.A.1.15.5 | The ATP-binding Cassette (ABC) Superfamily | 0.53 | 0.8 | 1 | -0.39 | 0.99 | 1 | 1 | -0.0034 | 1 | 1 | 1 | 0.5 | 0.93 | 0.53 | 0.95 | 0.00046 | 7.7e-05 | 0 | 1.5e-05 | 0 | 3.3e-05 | 0.00017 | 0 | 0.00046 | 3.5 | 3 / 18 (17%) | 2 / 11 (18%) | 1 / 7 (14%) | 0.182 | 0.143 |
| 8.A.3.2.3 | The Cytoplasmic Membrane-Periplasmic Auxiliary-1 (MPA1) Protein with Cytoplasmic (C) Domain (MPA1-C or MPA1+C) Family | 0.3 | 0.8 | 1 | -0.59 | 0.72 | 1 | 1 | -0.21 | 0.63 | 1 | 1 | 0.61 | 0.95 | 0.54 | 0.96 | 0.00013 | 6e-05 | 0 | 3.4e-05 | 0 | 5.1e-05 | 1e-04 | 2.7e-05 | 0.00013 | 1.6 | 8 / 18 (44%) | 4 / 11 (36%) | 4 / 7 (57%) | 0.364 | 0.571 |
| 3.A.1.2.3 | The ATP-binding Cassette (ABC) Superfamily | 0.47 | 0.8 | 1 | -0.47 | 0.71 | 1 | 1 | -0.19 | 1 | 1 | 1 | 0.51 | 0.91 | 0.55 | 0.95 | 0.00058 | 9.6e-05 | 0 | 9.2e-06 | 0 | 2.2e-05 | 0.00023 | 0 | 0.00061 | 4.6 | 3 / 18 (17%) | 2 / 11 (18%) | 1 / 7 (14%) | 0.182 | 0.143 |
| 2.A.3.2.8 | The Amino Acid-Polyamine-Organocation (APC) Family | 0.26 | 0.8 | 1 | -0.76 | 0.2 | 1 | 1 | -0.87 | 0.53 | 1 | 1 | 0.48 | 0.93 | 0.5 | 0.94 | 0.00032 | 5.4e-05 | 0 | 2.7e-06 | 0 | 8.9e-06 | 0.00013 | 0 | 3e-04 | 5.6 | 3 / 18 (17%) | 1 / 11 (9.1%) | 2 / 7 (29%) | 0.0909 | 0.286 |
| 2.A.17.1.4 | The Proton-dependent Oligopeptide Transporter (POT/PTR) Family | 0.56 | 0.8 | 1 | -0.37 | 0.85 | 1 | 1 | 0.092 | 1 | 1 | 1 | 0.49 | 0.93 | 0.54 | 0.95 | 0.00049 | 0.00011 | 0 | 1.9e-05 | 0 | 3.8e-05 | 0.00025 | 0 | 0.00067 | 3.7 | 4 / 18 (22%) | 3 / 11 (27%) | 1 / 7 (14%) | 0.273 | 0.143 |
| 2.A.115.2.9 | The Novobiocin Exporter (NbcE) Family | 0.25 | 0.8 | 1 | 0.48 | 0.22 | 1 | 1 | 0.63 | 1 | 1 | 1 | 0.51 | 0.94 | 0.53 | 0.96 | 0.00037 | 8.2e-05 | 0 | 0.00013 | 0 | 0.00028 | 1.3e-05 | 0 | 3.5e-05 | -3.3 | 4 / 18 (22%) | 3 / 11 (27%) | 1 / 7 (14%) | 0.273 | 0.143 |
| 1.B.23.1.16 | The Cyanobacterial Porin (CBP) Family | 0.37 | 0.8 | 1 | -0.55 | 0.55 | 1 | 1 | -0.32 | 1 | 1 | 1 | 0.53 | 0.93 | 0.59 | 0.96 | 0.00026 | 5.7e-05 | 0 | 1.8e-05 | 0 | 4.5e-05 | 0.00012 | 0 | 0.00023 | 2.7 | 4 / 18 (22%) | 2 / 11 (18%) | 2 / 7 (29%) | 0.182 | 0.286 |
| 2.A.7.3.57 | The Drug/Metabolite Transporter (DMT) Superfamily | 0.79 | 0.88 | 1 | 0.12 | 0.71 | 1 | 1 | 0.2 | 1 | 1 | 1 | 0.59 | 0.94 | 0.63 | 0.96 | 0.00037 | 1e-04 | 0 | 0.00013 | 0 | 0.00039 | 5.3e-05 | 0 | 9.8e-05 | -1.3 | 5 / 18 (28%) | 3 / 11 (27%) | 2 / 7 (29%) | 0.273 | 0.286 |
| 2.A.1.6.4 | The Major Facilitator Superfamily (MFS) | 0.7 | 0.83 | 1 | -0.22 | 0.7 | 1 | 1 | 0.17 | 1 | 1 | 1 | 0.5 | 0.93 | 0.56 | 0.95 | 0.00037 | 6.2e-05 | 0 | 3.4e-05 | 0 | 1e-04 | 0.00011 | 0 | 0.00028 | 1.7 | 3 / 18 (17%) | 2 / 11 (18%) | 1 / 7 (14%) | 0.182 | 0.143 |
| 1.B.10.1.1 | The Nucleoside-specific Channel-forming Outer Membrane Porin (Tsx) Family | 0.61 | 0.8 | 1 | -0.31 | 0.73 | 1 | 1 | 0.15 | 1 | 1 | 1 | 0.45 | 0.93 | 0.5 | 0.95 | 0.00023 | 3.8e-05 | 0 | 1.3e-05 | 0 | 3.5e-05 | 7.7e-05 | 0 | 2e-04 | 2.6 | 3 / 18 (17%) | 2 / 11 (18%) | 1 / 7 (14%) | 0.182 | 0.143 |
| 1.B.14.7.1 | The Outer Membrane Receptor (OMR) Family | 0.38 | 0.8 | 1 | -0.56 | 0.44 | 1 | 1 | -0.44 | 1 | 1 | 1 | 0.52 | 0.93 | 0.53 | 0.95 | 0.00081 | 0.00018 | 0 | 2.1e-05 | 0 | 4.7e-05 | 0.00043 | 0 | 0.0011 | 4.4 | 4 / 18 (22%) | 2 / 11 (18%) | 2 / 7 (29%) | 0.182 | 0.286 |
| 9.B.14.1.17 | The Putative Heme Handling Protein (HHP) Family | 0.59 | 0.8 | 1 | 0.24 | 0.54 | 1 | 1 | 0.32 | 1 | 1 | 1 | 0.66 | 0.95 | 0.72 | 0.97 | 0.00032 | 0.00016 | 2.7e-05 | 0.00021 | 5.9e-05 | 0.00057 | 8.1e-05 | 0 | 0.00014 | -1.4 | 9 / 18 (50%) | 6 / 11 (55%) | 3 / 7 (43%) | 0.545 | 0.429 |
| 3.A.1.121.6 | The ATP-binding Cassette (ABC) Superfamily | 0.45 | 0.8 | 1 | 0.35 | 0.41 | 1 | 1 | 0.43 | 0.64 | 1 | 1 | 0.53 | 0.93 | 0.54 | 0.96 | 0.00023 | 9.1e-05 | 0 | 0.00012 | 0 | 0.00022 | 4.8e-05 | 0 | 8.6e-05 | -1.3 | 7 / 18 (39%) | 5 / 11 (45%) | 2 / 7 (29%) | 0.455 | 0.286 |
| 1.B.25.1.13 | The Outer Membrane Porin (Opr) Family | 0.66 | 0.81 | 1 | -0.26 | 0.55 | 1 | 1 | 0.25 | 1 | 1 | 1 | 0.54 | 0.94 | 0.55 | 0.96 | 0.00018 | 3.1e-05 | 0 | 1.3e-05 | 0 | 3.5e-05 | 5.8e-05 | 0 | 0.00015 | 2.2 | 3 / 18 (17%) | 2 / 11 (18%) | 1 / 7 (14%) | 0.182 | 0.143 |
| 9.B.223.1.4 | The 4 TMS DUF2979 or YoaS (YoaS) Family | 0.75 | 0.85 | 1 | -0.15 | 0.98 | 1 | 1 | -0.016 | 0.63 | 1 | 1 | 0.55 | 0.94 | 0.62 | 0.97 | 2e-04 | 6.6e-05 | 0 | 6.9e-05 | 0 | 2e-04 | 6.1e-05 | 0 | 0.00011 | -0.18 | 6 / 18 (33%) | 3 / 11 (27%) | 3 / 7 (43%) | 0.273 | 0.429 |
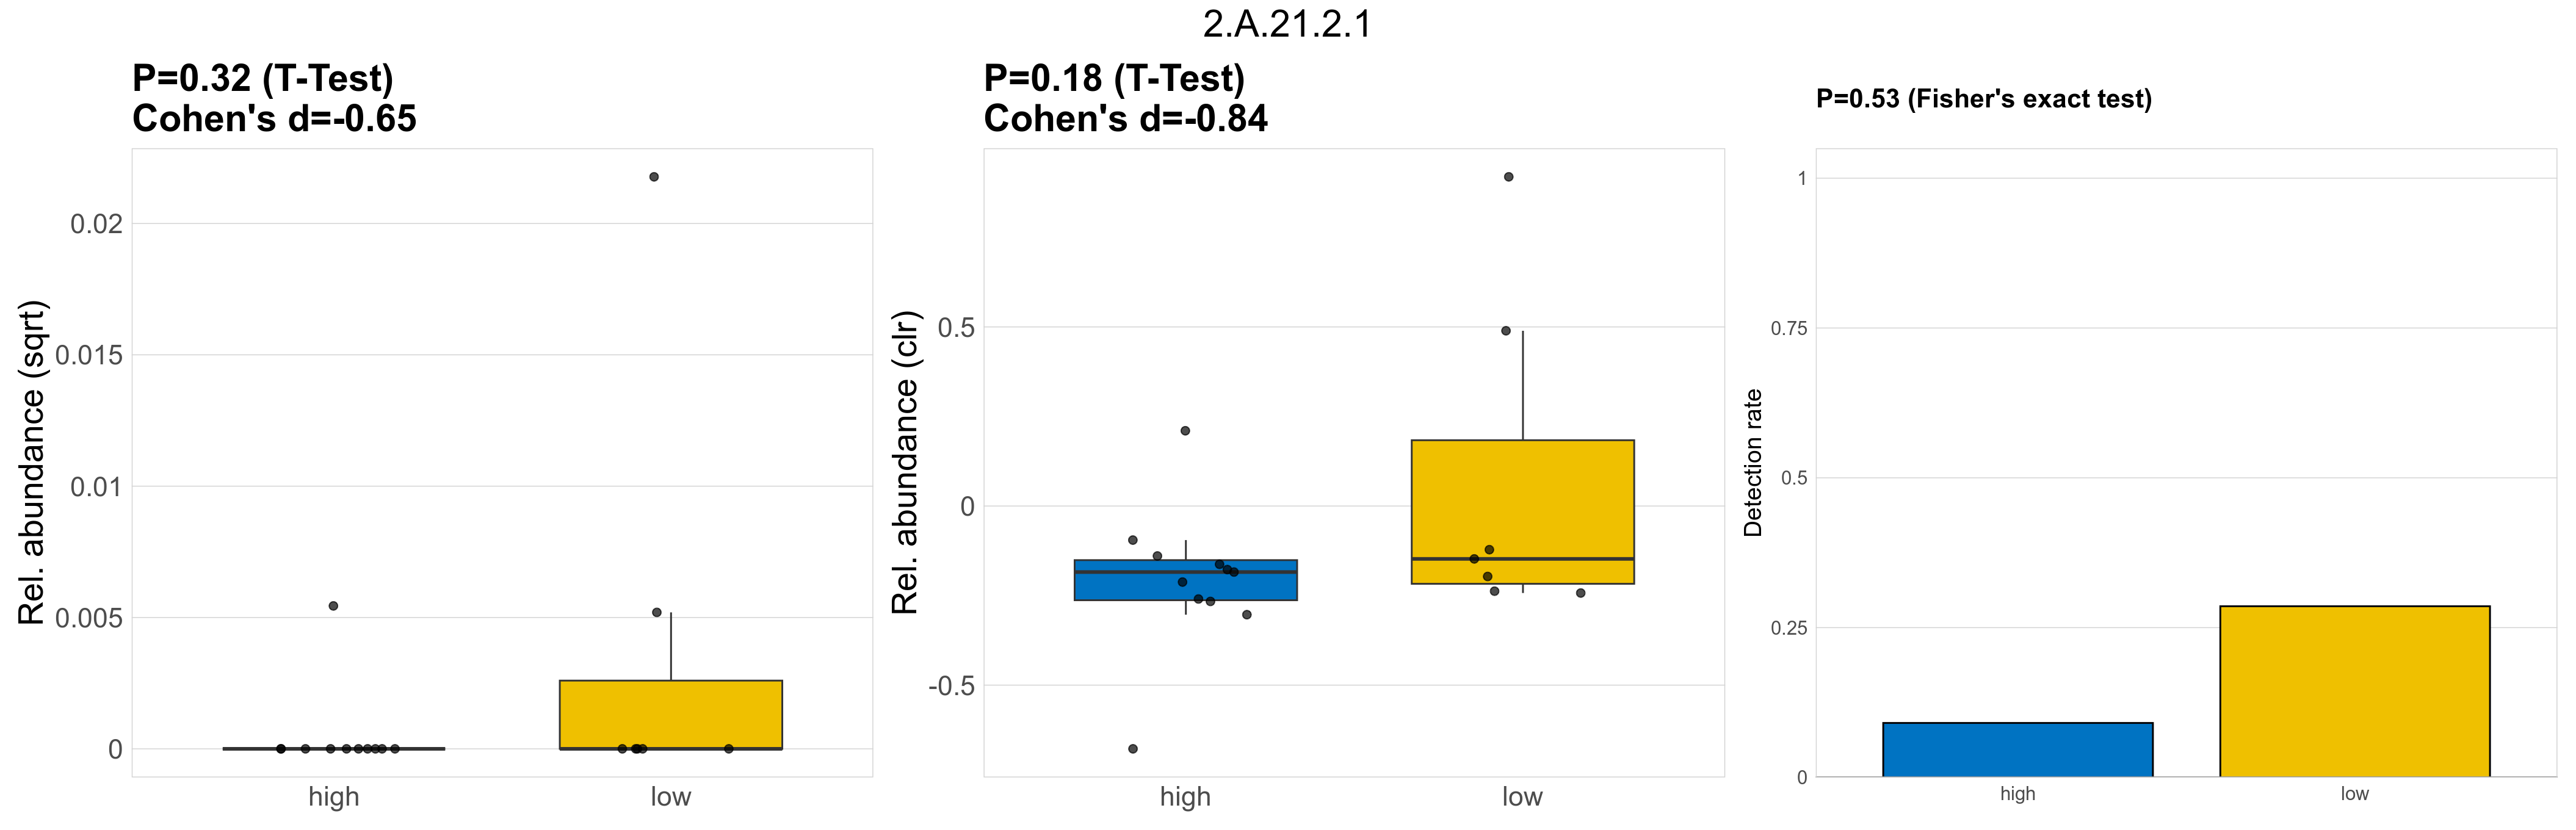
| 2.A.21.2.1 | The Solute:Sodium Symporter (SSS) Family | 0.32 | 0.8 | 1 | -0.65 | 0.18 | 1 | 1 | -0.84 | 0.53 | 1 | 1 | 0.5 | 0.93 | 0.53 | 0.95 | 0.00018 | 2.9e-05 | 0 | 2.7e-06 | 0 | 8.9e-06 | 7.2e-05 | 0 | 0.00018 | 4.7 | 3 / 18 (17%) | 1 / 11 (9.1%) | 2 / 7 (29%) | 0.0909 | 0.286 |
| 3.D.2.1.1 | The Proton-translocating Transhydrogenase (PTH) Family | 0.5 | 0.8 | 1 | -0.41 | 0.83 | 1 | 1 | -0.11 | 1 | 1 | 1 | 0.51 | 0.93 | 0.55 | 0.96 | 0.00034 | 9.4e-05 | 0 | 3.3e-05 | 0 | 7e-05 | 0.00019 | 0 | 0.00046 | 2.5 | 5 / 18 (28%) | 3 / 11 (27%) | 2 / 7 (29%) | 0.273 | 0.286 |
| 9.B.126.1.2 | The Putative Lipid IV Exporter (YhjD) Family | 0.3 | 0.8 | 1 | 0.5 | 0.23 | 1 | 1 | 0.59 | 1 | 1 | 1 | 0.43 | 0.93 | 0.31 | 0.94 | 0.00062 | 0.00048 | 0.00035 | 0.00059 | 0.00038 | 0.00057 | 0.00032 | 0.00024 | 0.00034 | -0.88 | 14 / 18 (78%) | 9 / 11 (82%) | 5 / 7 (71%) | 0.818 | 0.714 |
| 3.A.1.12.15 | The ATP-binding Cassette (ABC) Superfamily | 0.76 | 0.87 | 1 | -0.18 | 0.34 | 1 | 1 | 0.42 | 1 | 1 | 1 | 0.48 | 0.93 | 0.49 | 0.94 | 0.00026 | 5.7e-05 | 0 | 2.5e-05 | 0 | 4.4e-05 | 0.00011 | 0 | 0.00028 | 2.1 | 4 / 18 (22%) | 3 / 11 (27%) | 1 / 7 (14%) | 0.273 | 0.143 |
| 3.A.3.7.1 | The P-type ATPase (P-ATPase) Superfamily | 0.63 | 0.8 | 1 | -0.29 | 0.75 | 1 | 1 | 0.14 | 1 | 1 | 1 | 0.47 | 0.93 | 0.49 | 0.95 | 0.00041 | 6.9e-05 | 0 | 2.6e-05 | 0 | 6.9e-05 | 0.00014 | 0 | 0.00036 | 2.4 | 3 / 18 (17%) | 2 / 11 (18%) | 1 / 7 (14%) | 0.182 | 0.143 |
| 3.A.1.5.10 | The ATP-binding Cassette (ABC) Superfamily | 0.9 | 0.95 | 1 | 0.073 | 0.45 | 1 | 1 | 0.43 | 0.32 | 1 | 1 | 0.62 | 0.95 | 0.56 | 0.96 | 0.00027 | 8.9e-05 | 0 | 6e-05 | 0 | 8.2e-05 | 0.00013 | 0 | 0.00036 | 1.1 | 6 / 18 (33%) | 5 / 11 (45%) | 1 / 7 (14%) | 0.455 | 0.143 |
| 2.A.1.42.1 | The Major Facilitator Superfamily (MFS) | 0.59 | 0.8 | 1 | -0.33 | 0.8 | 1 | 1 | 0.11 | 1 | 1 | 1 | 0.46 | 0.93 | 0.5 | 0.95 | 0.00025 | 4.2e-05 | 0 | 1.3e-05 | 0 | 3.5e-05 | 8.7e-05 | 0 | 0.00023 | 2.7 | 3 / 18 (17%) | 2 / 11 (18%) | 1 / 7 (14%) | 0.182 | 0.143 |
| 3.A.1.4.10 | The ATP-binding Cassette (ABC) Superfamily | 0.67 | 0.81 | 1 | 0.21 | 0.2 | 1 | 1 | 0.52 | 1 | 1 | 1 | 0.49 | 0.93 | 0.52 | 0.95 | 0.00017 | 3.8e-05 | 0 | 4.3e-05 | 0 | 8.9e-05 | 2.9e-05 | 0 | 7.7e-05 | -0.57 | 4 / 18 (22%) | 3 / 11 (27%) | 1 / 7 (14%) | 0.273 | 0.143 |
| 9.B.114.1.1 | The Vancomycin-sensitivity protein (SanA) Family | 0.82 | 0.9 | 1 | -0.12 | 0.44 | 1 | 1 | 0.31 | 1 | 1 | 1 | 0.49 | 0.93 | 0.53 | 0.96 | 0.00023 | 3.9e-05 | 0 | 2.7e-05 | 0 | 7e-05 | 5.8e-05 | 0 | 0.00015 | 1.1 | 3 / 18 (17%) | 2 / 11 (18%) | 1 / 7 (14%) | 0.182 | 0.143 |
| 2.A.6.2.2 | The Resistance-Nodulation-Cell Division (RND) Superfamily | 0.36 | 0.8 | 1 | -0.6 | 0.26 | 1 | 1 | -0.67 | 0.53 | 1 | 1 | 0.45 | 0.93 | 0.47 | 0.95 | 0.00067 | 0.00011 | 0 | 8.1e-06 | 0 | 2.7e-05 | 0.00028 | 0 | 0.00072 | 5.1 | 3 / 18 (17%) | 1 / 11 (9.1%) | 2 / 7 (29%) | 0.0909 | 0.286 |
| 2.A.6.2.12 | The Resistance-Nodulation-Cell Division (RND) Superfamily | 0.47 | 0.8 | 1 | -0.45 | 0.69 | 1 | 1 | -0.2 | 1 | 1 | 1 | 0.53 | 0.94 | 0.56 | 0.95 | 0.00065 | 0.00014 | 0 | 3.4e-05 | 0 | 7.8e-05 | 0.00032 | 0 | 0.00082 | 3.2 | 4 / 18 (22%) | 2 / 11 (18%) | 2 / 7 (29%) | 0.182 | 0.286 |
| 2.A.3.1.6 | The Amino Acid-Polyamine-Organocation (APC) Family | 0.58 | 0.8 | 1 | -0.34 | 0.86 | 1 | 1 | 0.08 | 1 | 1 | 1 | 0.45 | 0.93 | 0.47 | 0.95 | 0.00027 | 4.6e-05 | 0 | 1.3e-05 | 0 | 3.5e-05 | 9.7e-05 | 0 | 0.00026 | 2.9 | 3 / 18 (17%) | 2 / 11 (18%) | 1 / 7 (14%) | 0.182 | 0.143 |
| 2.A.9.3.1 | The Membrane Protein Insertase (YidC/Alb3/Oxa1) Family | 0.66 | 0.81 | 1 | -0.26 | 0.68 | 1 | 1 | 0.18 | 1 | 1 | 1 | 0.51 | 0.94 | 0.53 | 0.96 | 0.00037 | 6.1e-05 | 0 | 2.6e-05 | 0 | 6.9e-05 | 0.00012 | 0 | 0.00031 | 2.2 | 3 / 18 (17%) | 2 / 11 (18%) | 1 / 7 (14%) | 0.182 | 0.143 |
| 3.A.1.1.48 | The ATP-binding Cassette (ABC) Superfamily | 0.88 | 0.94 | 1 | 0.072 | 0.66 | 1 | 1 | 0.21 | 1 | 1 | 1 | 0.65 | 0.95 | 0.68 | 0.97 | 0.0026 | 0.0013 | 5e-05 | 0.0014 | 1e-04 | 0.0021 | 0.0012 | 0 | 0.0017 | -0.22 | 9 / 18 (50%) | 6 / 11 (55%) | 3 / 7 (43%) | 0.545 | 0.429 |
| 2.A.6.1.4 | The Resistance-Nodulation-Cell Division (RND) Superfamily | 0.74 | 0.85 | 1 | -0.19 | 0.38 | 1 | 1 | 0.39 | 1 | 1 | 1 | 0.49 | 0.93 | 0.54 | 0.95 | 3e-04 | 6.6e-05 | 0 | 2.8e-05 | 0 | 4.9e-05 | 0.00013 | 0 | 0.00033 | 2.2 | 4 / 18 (22%) | 3 / 11 (27%) | 1 / 7 (14%) | 0.273 | 0.143 |
| 2.A.15.2.1 | The Betaine/Carnitine/Choline Transporter (BCCT) Family | 0.5 | 0.8 | 1 | -0.42 | 0.85 | 1 | 1 | -0.1 | 1 | 1 | 1 | 0.47 | 0.92 | 0.5 | 0.95 | 5e-04 | 8.3e-05 | 0 | 1.3e-05 | 0 | 3.5e-05 | 0.00019 | 0 | 0.00051 | 3.9 | 3 / 18 (17%) | 2 / 11 (18%) | 1 / 7 (14%) | 0.182 | 0.143 |
| 1.A.8.3.1 | The Major Intrinsic Protein (MIP) Family | 0.91 | 0.96 | 1 | -0.057 | 0.23 | 1 | 1 | 0.49 | 1 | 1 | 1 | 0.5 | 0.93 | 0.56 | 0.96 | 0.00013 | 2.2e-05 | 0 | 1.8e-05 | 0 | 4e-05 | 2.9e-05 | 0 | 7.7e-05 | 0.69 | 3 / 18 (17%) | 2 / 11 (18%) | 1 / 7 (14%) | 0.182 | 0.143 |
| 2.A.81.1.5 | The Aspartate:Alanine Exchanger (AAEx) Family | 0.53 | 0.8 | 1 | -0.39 | 0.99 | 1 | 1 | 0.0083 | 1 | 1 | 1 | 0.5 | 0.93 | 0.54 | 0.96 | 0.00066 | 0.00011 | 0 | 2.1e-05 | 0 | 4.7e-05 | 0.00025 | 0 | 0.00067 | 3.6 | 3 / 18 (17%) | 2 / 11 (18%) | 1 / 7 (14%) | 0.182 | 0.143 |
| 2.A.66.2.7 | The Multidrug/Oligosaccharidyl-lipid/Polysaccharide (MOP) Flippase Superfamily | 0.39 | 0.8 | 1 | -0.54 | 0.39 | 1 | 1 | -0.43 | 0.53 | 1 | 1 | 0.45 | 0.93 | 0.49 | 0.95 | 0.00027 | 4.6e-05 | 0 | 1.1e-05 | 0 | 3.6e-05 | 1e-04 | 0 | 0.00025 | 3.2 | 3 / 18 (17%) | 1 / 11 (9.1%) | 2 / 7 (29%) | 0.0909 | 0.286 |
| 4.A.6.1.1 | The PTS Mannose-Fructose-Sorbose (Man) Family | 0.44 | 0.8 | 1 | -0.47 | 0.63 | 1 | 1 | -0.25 | 1 | 1 | 1 | 0.47 | 0.93 | 0.48 | 0.95 | 0.00024 | 5.4e-05 | 0 | 1.6e-05 | 0 | 3.7e-05 | 0.00011 | 0 | 0.00028 | 2.8 | 4 / 18 (22%) | 2 / 11 (18%) | 2 / 7 (29%) | 0.182 | 0.286 |
| 1.B.54.1.9 | The Intimin/Invasin (Int/Inv) or Autotransporter-3 (AT-3) Family | 0.27 | 0.8 | 1 | -0.72 | 0.24 | 1 | 1 | -0.76 | 0.53 | 1 | 1 | 0.46 | 0.93 | 0.5 | 0.95 | 0.00014 | 2.4e-05 | 0 | 2.7e-06 | 0 | 8.9e-06 | 5.7e-05 | 0 | 0.00013 | 4.4 | 3 / 18 (17%) | 1 / 11 (9.1%) | 2 / 7 (29%) | 0.0909 | 0.286 |
| 3.A.1.5.21 | The ATP-binding Cassette (ABC) Superfamily | 0.36 | 0.8 | 1 | -0.6 | 0.28 | 1 | 1 | -0.66 | 0.53 | 1 | 1 | 0.43 | 0.92 | 0.45 | 0.94 | 0.00083 | 0.00014 | 0 | 8.1e-06 | 0 | 2.7e-05 | 0.00034 | 0 | 0.00089 | 5.4 | 3 / 18 (17%) | 1 / 11 (9.1%) | 2 / 7 (29%) | 0.0909 | 0.286 |
| 3.A.1.8.1 | The ATP-binding Cassette (ABC) Superfamily | 0.46 | 0.8 | 1 | -0.48 | 0.68 | 1 | 1 | -0.22 | 1 | 1 | 1 | 0.52 | 0.93 | 0.53 | 0.94 | 0.00069 | 0.00011 | 0 | 9.2e-06 | 0 | 2.2e-05 | 0.00028 | 0 | 0.00074 | 4.9 | 3 / 18 (17%) | 2 / 11 (18%) | 1 / 7 (14%) | 0.182 | 0.143 |
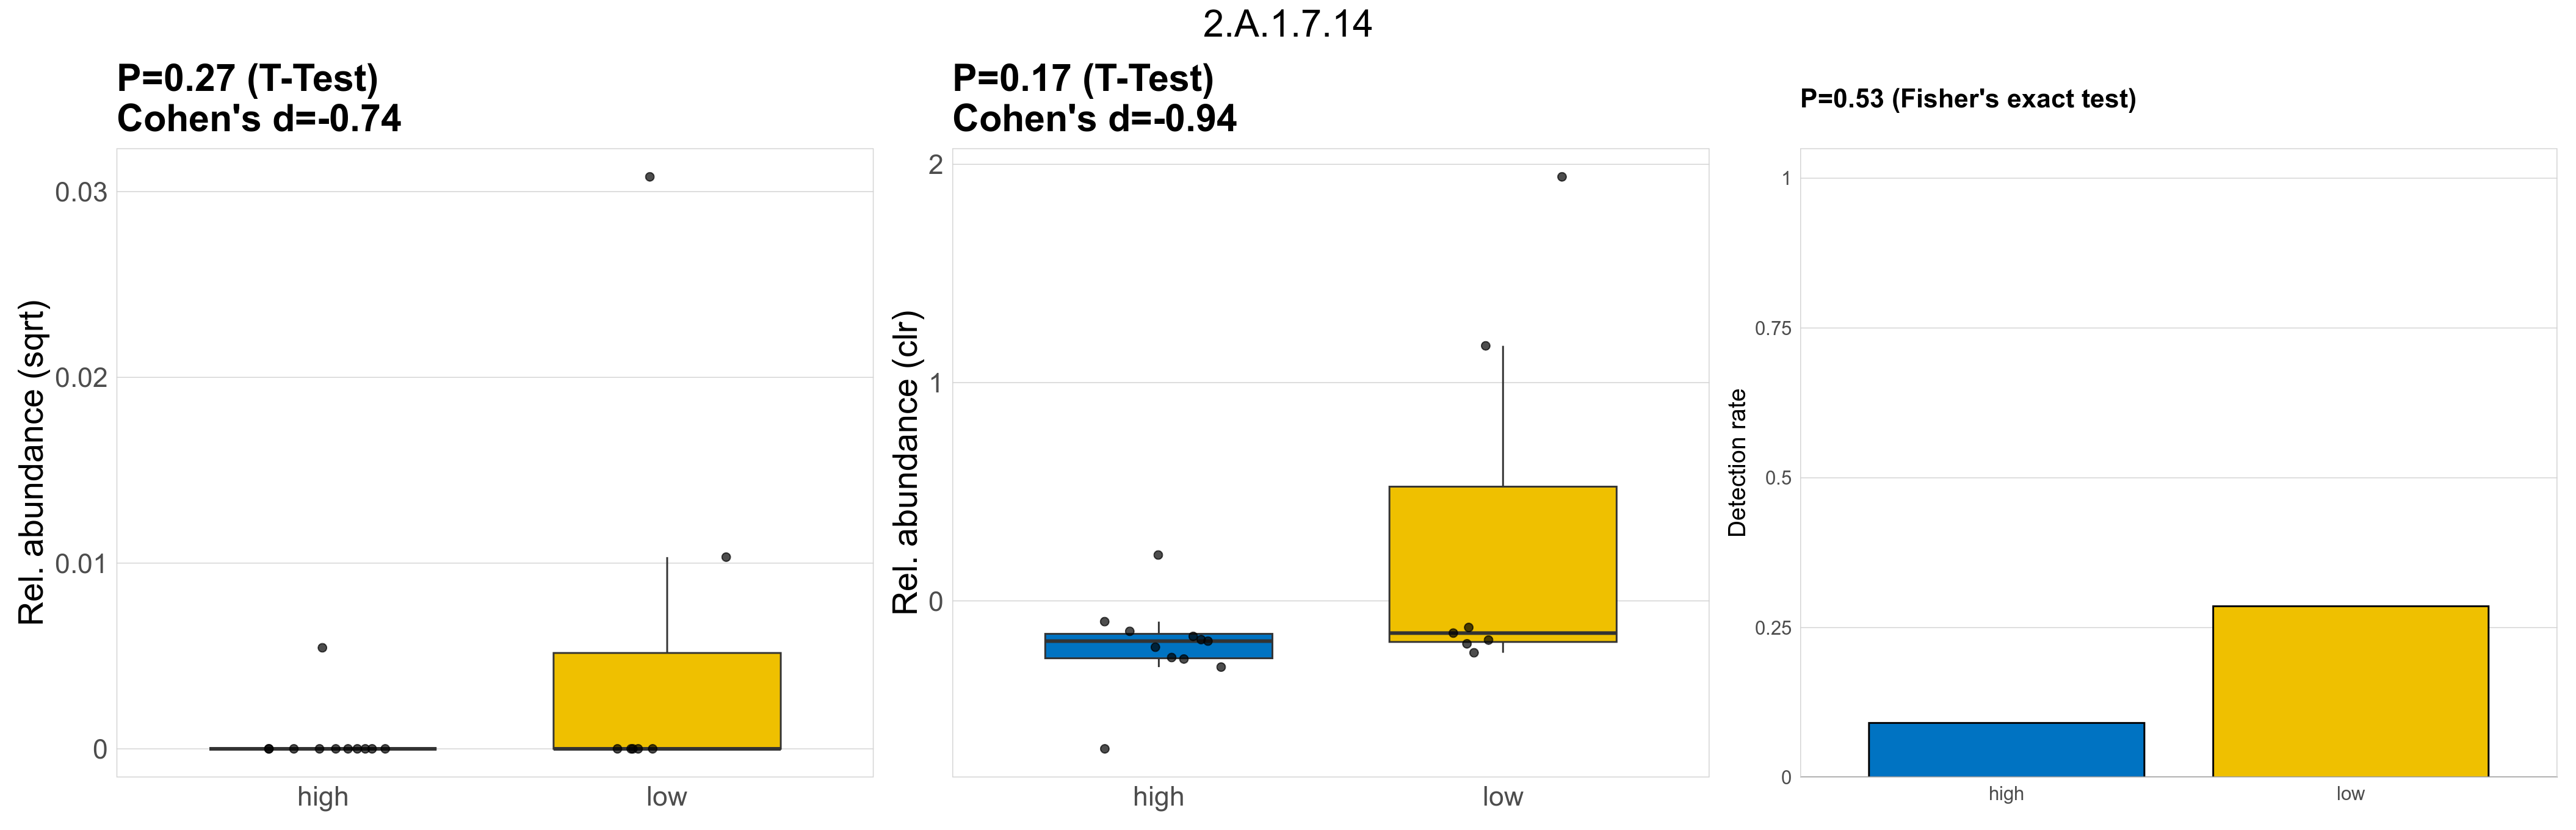
| 2.A.1.7.14 | The Major Facilitator Superfamily (MFS) | 0.27 | 0.8 | 1 | -0.74 | 0.17 | 1 | 1 | -0.94 | 0.53 | 1 | 1 | 0.42 | 0.91 | 0.46 | 0.93 | 0.00036 | 6e-05 | 0 | 2.7e-06 | 0 | 8.9e-06 | 0.00015 | 0 | 0.00035 | 5.8 | 3 / 18 (17%) | 1 / 11 (9.1%) | 2 / 7 (29%) | 0.0909 | 0.286 |
| 1.B.3.1.1 | The Sugar Porin (SP) Family | 0.55 | 0.8 | 1 | -0.38 | 0.99 | 1 | 1 | 0.004 | 1 | 1 | 1 | 0.46 | 0.92 | 0.52 | 0.94 | 0.00034 | 5.7e-05 | 0 | 1.3e-05 | 0 | 3.5e-05 | 0.00013 | 0 | 0.00033 | 3.3 | 3 / 18 (17%) | 2 / 11 (18%) | 1 / 7 (14%) | 0.182 | 0.143 |
| 3.A.1.14.3 | The ATP-binding Cassette (ABC) Superfamily | 0.82 | 0.9 | 1 | -0.12 | 0.52 | 1 | 1 | 0.27 | 1 | 1 | 1 | 0.53 | 0.94 | 0.56 | 0.96 | 0.00062 | 1e-04 | 0 | 7e-05 | 0 | 0.00018 | 0.00015 | 0 | 0.00041 | 1.1 | 3 / 18 (17%) | 2 / 11 (18%) | 1 / 7 (14%) | 0.182 | 0.143 |
| 4.A.1.2.3 | The PTS Glucose-Glucoside (Glc) Family | 0.26 | 0.8 | 1 | -0.76 | 0.2 | 1 | 1 | -0.86 | 0.53 | 1 | 1 | 0.5 | 0.94 | 0.53 | 0.96 | 0.00023 | 3.8e-05 | 0 | 2.7e-06 | 0 | 8.9e-06 | 9.3e-05 | 0 | 2e-04 | 5.1 | 3 / 18 (17%) | 1 / 11 (9.1%) | 2 / 7 (29%) | 0.0909 | 0.286 |
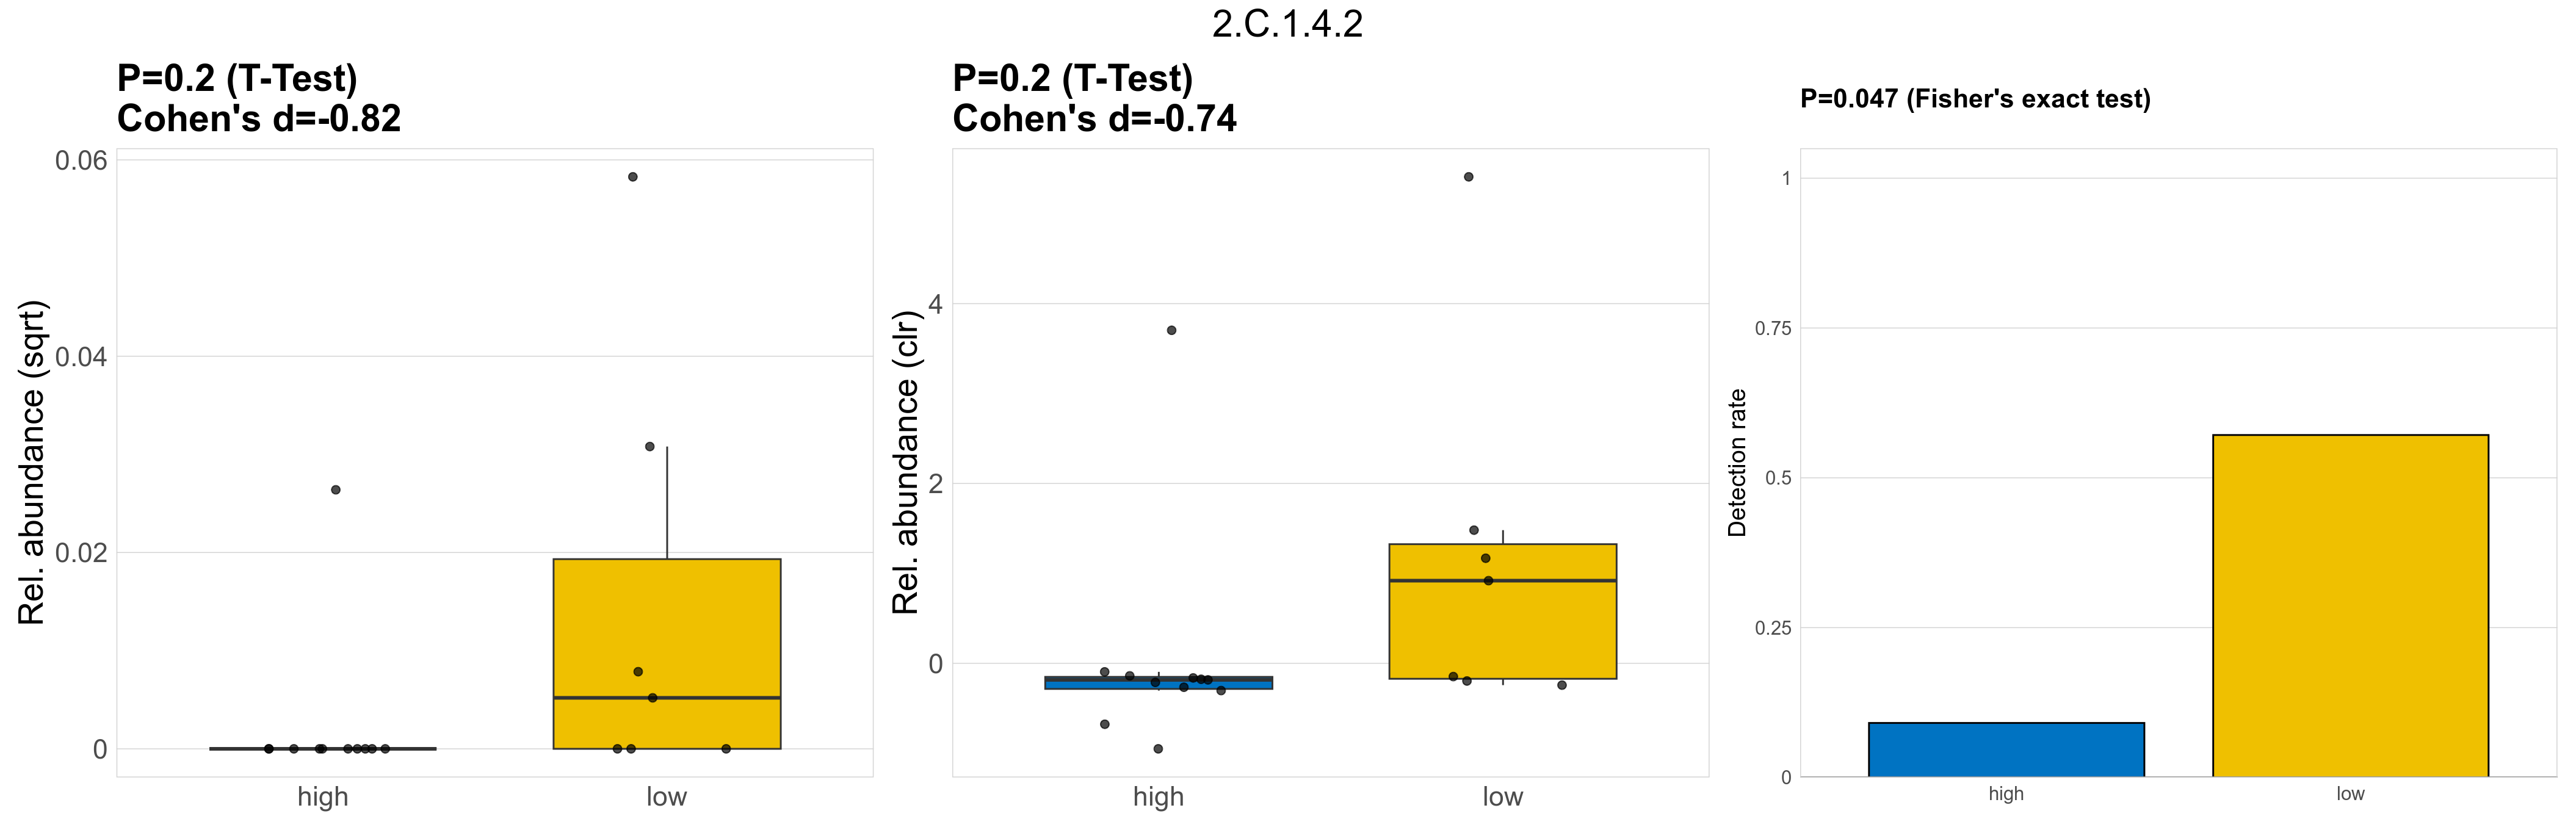
| 2.C.1.4.2 | The TonB-ExbB-ExbD/TolA-TolQ-TolR Outer Membrane Receptor Energizers and Stabilizers (TonB/TolA) Family | 0.2 | 0.8 | 1 | -0.82 | 0.2 | 1 | 1 | -0.74 | 0.047 | 1 | 1 | 0.33 | 0.91 | 0.33 | 0.93 | 0.001 | 0.00028 | 0 | 6.3e-05 | 0 | 0.00021 | 0.00063 | 2.7e-05 | 0.0013 | 3.3 | 5 / 18 (28%) | 1 / 11 (9.1%) | 4 / 7 (57%) | 0.0909 | 0.571 |
| 1.B.14.6.1 | The Outer Membrane Receptor (OMR) Family | 0.36 | 0.8 | 1 | 0.43 | 0.3 | 1 | 1 | 0.58 | 0.6 | 1 | 1 | 0.5 | 0.93 | 0.52 | 0.95 | 8.7e-05 | 2.4e-05 | 0 | 3.1e-05 | 0 | 5.1e-05 | 1.3e-05 | 0 | 3.5e-05 | -1.3 | 5 / 18 (28%) | 4 / 11 (36%) | 1 / 7 (14%) | 0.364 | 0.143 |
| 1.A.23.1.3 | The Small Conductance Mechanosensitive Ion Channel (MscS) Family | 0.56 | 0.8 | 1 | -0.37 | 0.83 | 1 | 1 | 0.11 | 1 | 1 | 1 | 0.5 | 0.93 | 0.55 | 0.95 | 0.00051 | 0.00011 | 0 | 1.9e-05 | 0 | 3.3e-05 | 0.00026 | 0 | 0.00069 | 3.8 | 4 / 18 (22%) | 3 / 11 (27%) | 1 / 7 (14%) | 0.273 | 0.143 |
| 1.B.71.1.5 | The Proteobacterial/Verrucomicrobial Porin (PVP) Family | 0.78 | 0.88 | 1 | 0.14 | 0.19 | 1 | 1 | 0.54 | 1 | 1 | 1 | 0.52 | 0.94 | 0.54 | 0.95 | 3e-04 | 6.7e-05 | 0 | 6.7e-05 | 0 | 0.00012 | 6.8e-05 | 0 | 0.00018 | 0.021 | 4 / 18 (22%) | 3 / 11 (27%) | 1 / 7 (14%) | 0.273 | 0.143 |
| 2.A.37.1.2 | The Monovalent Cation:Proton Antiporter-2 (CPA2) Family | 0.63 | 0.8 | 1 | -0.29 | 0.63 | 1 | 1 | 0.2 | 1 | 1 | 1 | 0.53 | 0.94 | 0.57 | 0.96 | 2e-04 | 3.4e-05 | 0 | 1.2e-05 | 0 | 2.7e-05 | 6.8e-05 | 0 | 0.00018 | 2.5 | 3 / 18 (17%) | 2 / 11 (18%) | 1 / 7 (14%) | 0.182 | 0.143 |
| 3.A.1.152.9 | The ATP-binding Cassette (ABC) Superfamily | 0.5 | 0.8 | 1 | -0.41 | 0.86 | 1 | 1 | -0.087 | 1 | 1 | 1 | 0.52 | 0.94 | 0.56 | 0.96 | 0.00047 | 0.00013 | 0 | 3.8e-05 | 0 | 7.4e-05 | 0.00028 | 0 | 0.00069 | 2.9 | 5 / 18 (28%) | 3 / 11 (27%) | 2 / 7 (29%) | 0.273 | 0.286 |
| 2.A.76.1.1 | The Resistance to Homoserine/Threonine (RhtB) Family | 0.99 | 0.99 | 1 | 0.0064 | 0.2 | 1 | 1 | 0.53 | 1 | 1 | 1 | 0.47 | 0.93 | 0.52 | 0.94 | 0.00023 | 5e-05 | 0 | 3.9e-05 | 0 | 7.7e-05 | 6.8e-05 | 0 | 0.00018 | 0.8 | 4 / 18 (22%) | 3 / 11 (27%) | 1 / 7 (14%) | 0.273 | 0.143 |
| 4.A.1.1.1 | The PTS Glucose-Glucoside (Glc) Family | 0.59 | 0.8 | 1 | -0.33 | 0.9 | 1 | 1 | 0.06 | 1 | 1 | 1 | 0.5 | 0.93 | 0.51 | 0.96 | 0.00042 | 7.1e-05 | 0 | 2.3e-05 | 0 | 6.8e-05 | 0.00015 | 0 | 0.00038 | 2.7 | 3 / 18 (17%) | 2 / 11 (18%) | 1 / 7 (14%) | 0.182 | 0.143 |
| 3.A.1.9.1 | The ATP-binding Cassette (ABC) Superfamily | 0.5 | 0.8 | 1 | -0.43 | 0.82 | 1 | 1 | -0.12 | 1 | 1 | 1 | 0.48 | 0.92 | 0.53 | 0.95 | 0.00054 | 9.1e-05 | 0 | 1.3e-05 | 0 | 3.5e-05 | 0.00021 | 0 | 0.00056 | 4 | 3 / 18 (17%) | 2 / 11 (18%) | 1 / 7 (14%) | 0.182 | 0.143 |
| 2.A.25.1.10 | The Alanine or Glycine:Cation Symporter (AGCS) Family | 0.62 | 0.8 | 1 | -0.3 | 0.79 | 1 | 1 | 0.11 | 1 | 1 | 1 | 0.49 | 0.93 | 0.56 | 0.96 | 0.00026 | 4.3e-05 | 0 | 1.6e-05 | 0 | 4.3e-05 | 8.7e-05 | 0 | 0.00023 | 2.4 | 3 / 18 (17%) | 2 / 11 (18%) | 1 / 7 (14%) | 0.182 | 0.143 |
| 3.A.1.2.25 | The ATP-binding Cassette (ABC) Superfamily | 0.47 | 0.8 | 1 | -0.47 | 0.79 | 1 | 1 | -0.14 | 1 | 1 | 1 | 0.51 | 0.94 | 0.53 | 0.96 | 0.00096 | 0.00016 | 0 | 1.5e-05 | 0 | 3.3e-05 | 0.00039 | 0 | 0.001 | 4.7 | 3 / 18 (17%) | 2 / 11 (18%) | 1 / 7 (14%) | 0.182 | 0.143 |
| 3.D.1.1.1 | The H+ or Na+-translocating NADH Dehydrogenase (NDH) Family | 0.47 | 0.8 | 1 | -0.46 | 0.79 | 1 | 1 | -0.14 | 1 | 1 | 1 | 0.56 | 0.94 | 0.63 | 0.97 | 0.00099 | 0.00027 | 0 | 5.1e-05 | 0 | 0.00011 | 0.00062 | 0 | 0.0016 | 3.6 | 5 / 18 (28%) | 3 / 11 (27%) | 2 / 7 (29%) | 0.273 | 0.286 |
| 8.A.46.2.2 | The Glycan-binding Protein (SusD) Family | 0.97 | 0.98 | 1 | 0.019 | 0.64 | 1 | 1 | 0.27 | 1 | 1 | 1 | 0.57 | 0.94 | 0.61 | 0.96 | 0.00011 | 1.8e-05 | 0 | 1.8e-05 | 0 | 5e-05 | 1.8e-05 | 0 | 4.7e-05 | 0 | 3 / 18 (17%) | 2 / 11 (18%) | 1 / 7 (14%) | 0.182 | 0.143 |
| 2.A.1.2.19 | The Major Facilitator Superfamily (MFS) | 0.95 | 0.97 | 1 | -0.035 | 0.26 | 1 | 1 | 0.46 | 1 | 1 | 1 | 0.48 | 0.93 | 0.52 | 0.96 | 0.00015 | 2.6e-05 | 0 | 2.3e-05 | 0 | 6.8e-05 | 2.9e-05 | 0 | 7.7e-05 | 0.33 | 3 / 18 (17%) | 2 / 11 (18%) | 1 / 7 (14%) | 0.182 | 0.143 |
| 2.A.1.21.1 | The Major Facilitator Superfamily (MFS) | 0.31 | 0.8 | 1 | 0.43 | 0.25 | 1 | 1 | 0.59 | 0.6 | 1 | 1 | 0.49 | 0.94 | 0.47 | 0.95 | 0.0012 | 0.00033 | 0 | 5e-04 | 0 | 0.0014 | 7.1e-05 | 0 | 0.00019 | -2.8 | 5 / 18 (28%) | 4 / 11 (36%) | 1 / 7 (14%) | 0.364 | 0.143 |
| 3.A.7.10.1 | The Type IV (Conjugal DNA-Protein Transfer or VirB) Secretory Pathway (IVSP) Family | 0.93 | 0.96 | 1 | 0.046 | 0.59 | 1 | 1 | 0.31 | 1 | 1 | 1 | 0.53 | 0.93 | 0.57 | 0.96 | 9.2e-05 | 1.5e-05 | 0 | 1.5e-05 | 0 | 3.6e-05 | 1.5e-05 | 0 | 4e-05 | 0 | 3 / 18 (17%) | 2 / 11 (18%) | 1 / 7 (14%) | 0.182 | 0.143 |
| 3.A.1.5.25 | The ATP-binding Cassette (ABC) Superfamily | 0.84 | 0.91 | 1 | -0.098 | 0.79 | 1 | 1 | 0.13 | 1 | 1 | 1 | 0.55 | 0.94 | 0.63 | 0.96 | 0.00014 | 3.1e-05 | 0 | 3.3e-05 | 0 | 8.7e-05 | 2.9e-05 | 0 | 5.3e-05 | -0.19 | 4 / 18 (22%) | 2 / 11 (18%) | 2 / 7 (29%) | 0.182 | 0.286 |
| 2.A.1.3.51 | The Major Facilitator Superfamily (MFS) | 0.58 | 0.8 | 1 | -0.35 | 0.8 | 1 | 1 | 0.12 | 1 | 1 | 1 | 0.48 | 0.93 | 0.52 | 0.95 | 0.00049 | 0.00011 | 0 | 2.2e-05 | 0 | 4.6e-05 | 0.00024 | 0 | 0.00064 | 3.4 | 4 / 18 (22%) | 3 / 11 (27%) | 1 / 7 (14%) | 0.273 | 0.143 |
| 2.A.42.1.3 | The Hydroxy/Aromatic Amino Acid Permease (HAAAP) Family | 0.58 | 0.8 | 1 | -0.34 | 0.86 | 1 | 1 | 0.08 | 1 | 1 | 1 | 0.52 | 0.94 | 0.57 | 0.96 | 0.00027 | 4.6e-05 | 0 | 1.3e-05 | 0 | 3.5e-05 | 9.7e-05 | 0 | 0.00026 | 2.9 | 3 / 18 (17%) | 2 / 11 (18%) | 1 / 7 (14%) | 0.182 | 0.143 |
| 3.A.3.32.7 | The P-type ATPase (P-ATPase) Superfamily | 0.6 | 0.8 | 1 | -0.3 | 0.99 | 1 | 1 | 0.0037 | 1 | 1 | 1 | 0.53 | 0.94 | 0.56 | 0.96 | 0.00051 | 0.00014 | 0 | 7.4e-05 | 0 | 0.00016 | 0.00025 | 0 | 0.00058 | 1.8 | 5 / 18 (28%) | 3 / 11 (27%) | 2 / 7 (29%) | 0.273 | 0.286 |
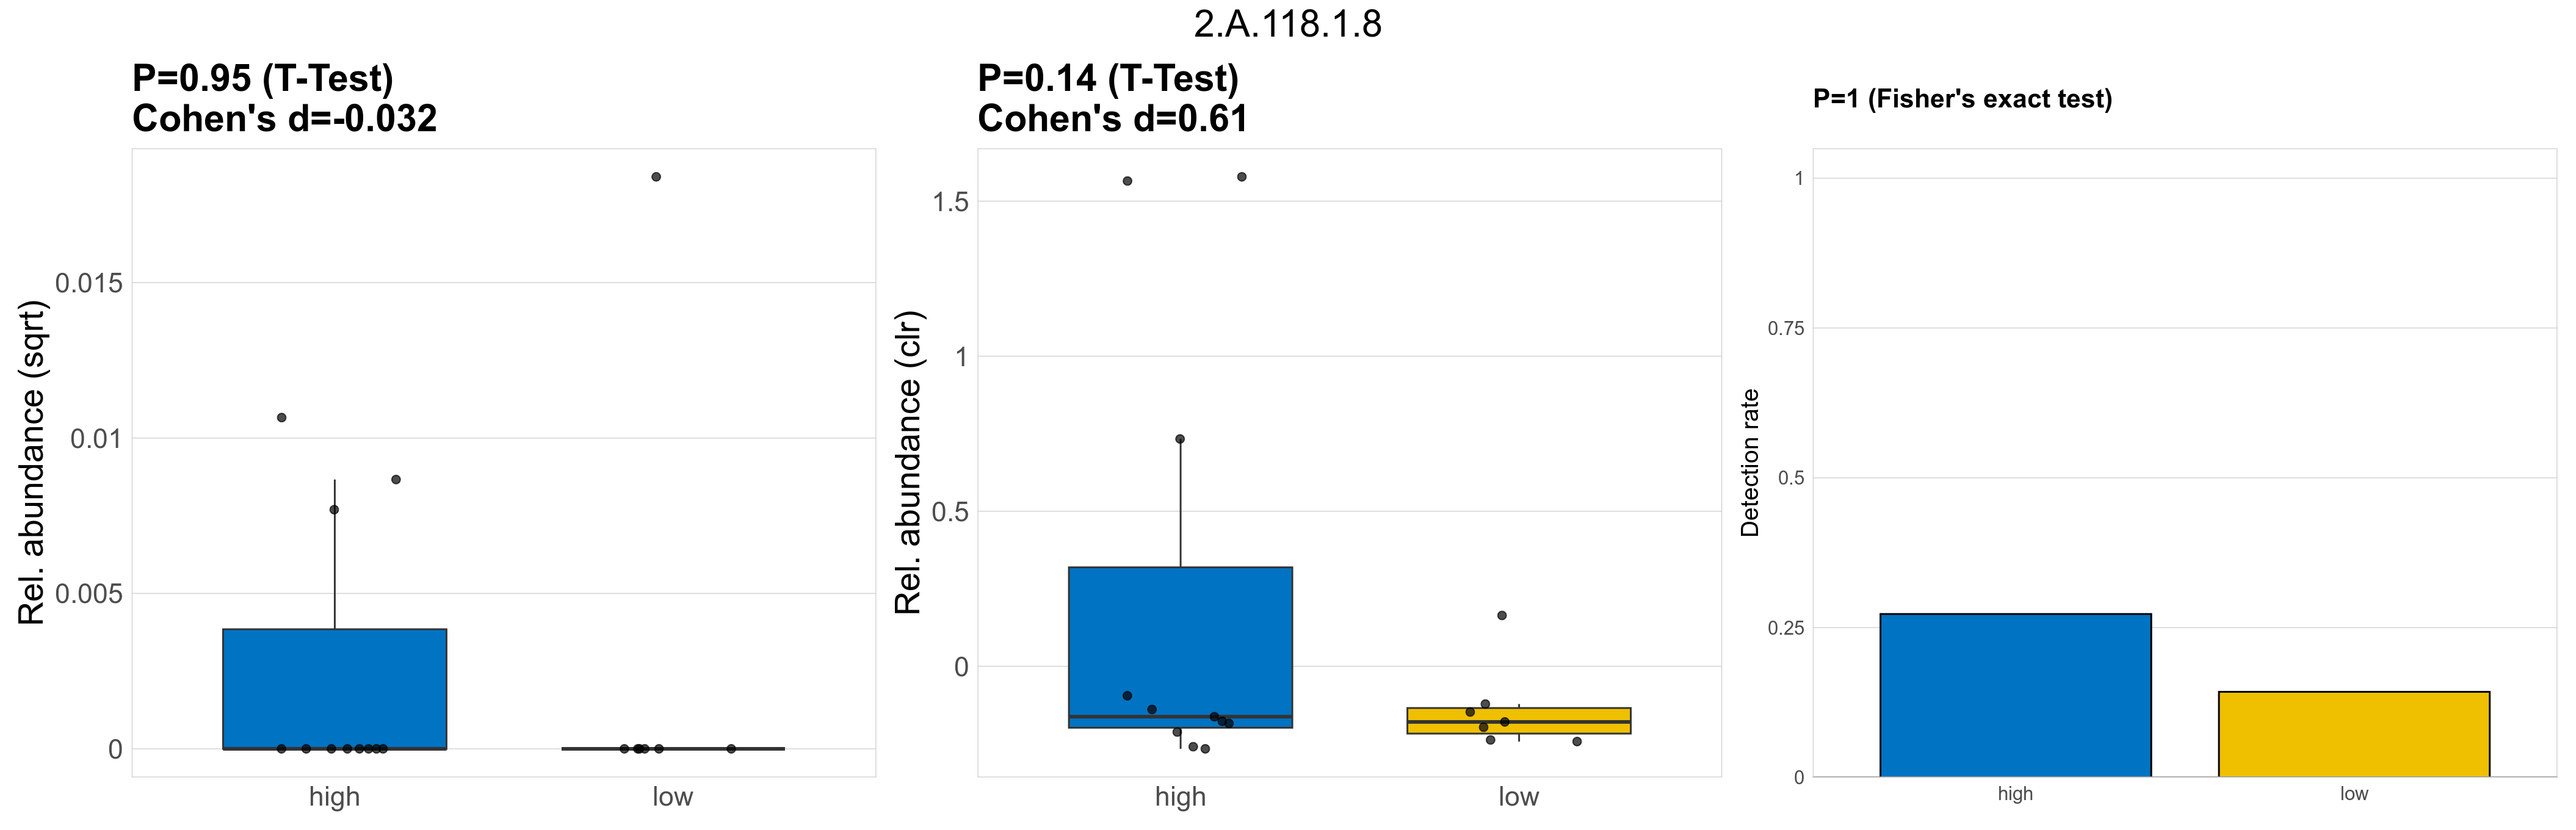
| 2.A.118.1.8 | The Basic Amino Acid Antiporter (ArcD) Family | 0.95 | 0.97 | 1 | -0.032 | 0.14 | 1 | 1 | 0.61 | 1 | 1 | 1 | 0.49 | 0.93 | 0.51 | 0.94 | 0.00015 | 3.3e-05 | 0 | 2.3e-05 | 0 | 4.1e-05 | 4.8e-05 | 0 | 0.00013 | 1.1 | 4 / 18 (22%) | 3 / 11 (27%) | 1 / 7 (14%) | 0.273 | 0.143 |
| 3.A.1.17.10 | The ATP-binding Cassette (ABC) Superfamily | 0.53 | 0.8 | 1 | -0.4 | 0.94 | 1 | 1 | -0.037 | 1 | 1 | 1 | 0.47 | 0.92 | 0.52 | 0.95 | 0.00031 | 5.1e-05 | 0 | 9.5e-06 | 0 | 2.3e-05 | 0.00012 | 0 | 0.00031 | 3.7 | 3 / 18 (17%) | 2 / 11 (18%) | 1 / 7 (14%) | 0.182 | 0.143 |
| 1.B.14.3.1 | The Outer Membrane Receptor (OMR) Family | 0.56 | 0.8 | 1 | -0.36 | 0.98 | 1 | 1 | 0.0096 | 1 | 1 | 1 | 0.51 | 0.93 | 0.55 | 0.96 | 0.00051 | 8.6e-05 | 0 | 2.3e-05 | 0 | 6.8e-05 | 0.00018 | 0 | 0.00049 | 3 | 3 / 18 (17%) | 2 / 11 (18%) | 1 / 7 (14%) | 0.182 | 0.143 |
| 2.A.46.1.9 | The Benzoate:H+ Symporter (BenE) Family | 0.66 | 0.81 | 1 | -0.26 | 0.55 | 1 | 1 | 0.25 | 1 | 1 | 1 | 0.55 | 0.94 | 0.57 | 0.96 | 0.00018 | 3.1e-05 | 0 | 1.3e-05 | 0 | 3.5e-05 | 5.8e-05 | 0 | 0.00015 | 2.2 | 3 / 18 (17%) | 2 / 11 (18%) | 1 / 7 (14%) | 0.182 | 0.143 |
| 2.A.2.2.1 | The Glycoside-Pentoside-Hexuronide (GPH):Cation Symporter Family | 0.55 | 0.8 | 1 | -0.31 | 0.99 | 1 | 1 | 0.0042 | 1 | 1 | 1 | 0.67 | 0.95 | 0.73 | 0.98 | 0.00018 | 0.00015 | 0.00012 | 0.00012 | 1e-04 | 0.00013 | 0.00019 | 0.00013 | 0.00018 | 0.66 | 15 / 18 (83%) | 9 / 11 (82%) | 6 / 7 (86%) | 0.818 | 0.857 |
| 1.B.22.1.3 | The Outer Bacterial Membrane Secretin (Secretin) Family | 0.49 | 0.8 | 1 | -0.44 | 0.84 | 1 | 1 | -0.11 | 1 | 1 | 1 | 0.49 | 0.93 | 0.52 | 0.95 | 0.00076 | 0.00013 | 0 | 1.6e-05 | 0 | 3.7e-05 | 3e-04 | 0 | 0.00079 | 4.2 | 3 / 18 (17%) | 2 / 11 (18%) | 1 / 7 (14%) | 0.182 | 0.143 |
| 3.A.1.31.1 | The ATP-binding Cassette (ABC) Superfamily | 0.5 | 0.8 | 1 | 0.36 | 0.24 | 1 | 1 | 0.64 | 0.25 | 1 | 1 | 0.32 | 0.92 | 0.32 | 0.94 | 0.0017 | 0.0014 | 0.0011 | 0.0015 | 0.0012 | 0.0013 | 0.0012 | 0.00084 | 0.0013 | -0.32 | 14 / 18 (78%) | 10 / 11 (91%) | 4 / 7 (57%) | 0.909 | 0.571 |
| 9.A.8.1.1 | The Ferrous Iron Uptake (FeoB) Family | 0.4 | 0.8 | 1 | -0.53 | 0.51 | 1 | 1 | -0.36 | 1 | 1 | 1 | 0.48 | 0.93 | 0.52 | 0.95 | 0.00046 | 1e-04 | 0 | 2.1e-05 | 0 | 4.7e-05 | 0.00023 | 0 | 0.00056 | 3.5 | 4 / 18 (22%) | 2 / 11 (18%) | 2 / 7 (29%) | 0.182 | 0.286 |
| 3.A.1.105.17 | The ATP-binding Cassette (ABC) Superfamily | 0.34 | 0.8 | 1 | -0.62 | 0.33 | 1 | 1 | -0.56 | 1 | 1 | 1 | 0.5 | 0.93 | 0.54 | 0.95 | 0.00041 | 9.1e-05 | 0 | 9.5e-06 | 0 | 2.3e-05 | 0.00022 | 0 | 0.00053 | 4.5 | 4 / 18 (22%) | 2 / 11 (18%) | 2 / 7 (29%) | 0.182 | 0.286 |
| 4.A.2.1.11 | The PTS Fructose-Mannitol (Fru) Family | 0.54 | 0.8 | 1 | -0.38 | 0.97 | 1 | 1 | 0.018 | 1 | 1 | 1 | 0.51 | 0.93 | 0.53 | 0.95 | 0.00062 | 1e-04 | 0 | 2.3e-05 | 0 | 5.6e-05 | 0.00023 | 0 | 0.00061 | 3.3 | 3 / 18 (17%) | 2 / 11 (18%) | 1 / 7 (14%) | 0.182 | 0.143 |
| 4.A.2.1.2 | The PTS Fructose-Mannitol (Fru) Family | 0.53 | 0.8 | 1 | -0.39 | 0.99 | 1 | 1 | -0.0057 | 1 | 1 | 1 | 0.47 | 0.93 | 0.48 | 0.95 | 0.00038 | 6.4e-05 | 0 | 1.2e-05 | 0 | 2.7e-05 | 0.00015 | 0 | 0.00038 | 3.6 | 3 / 18 (17%) | 2 / 11 (18%) | 1 / 7 (14%) | 0.182 | 0.143 |
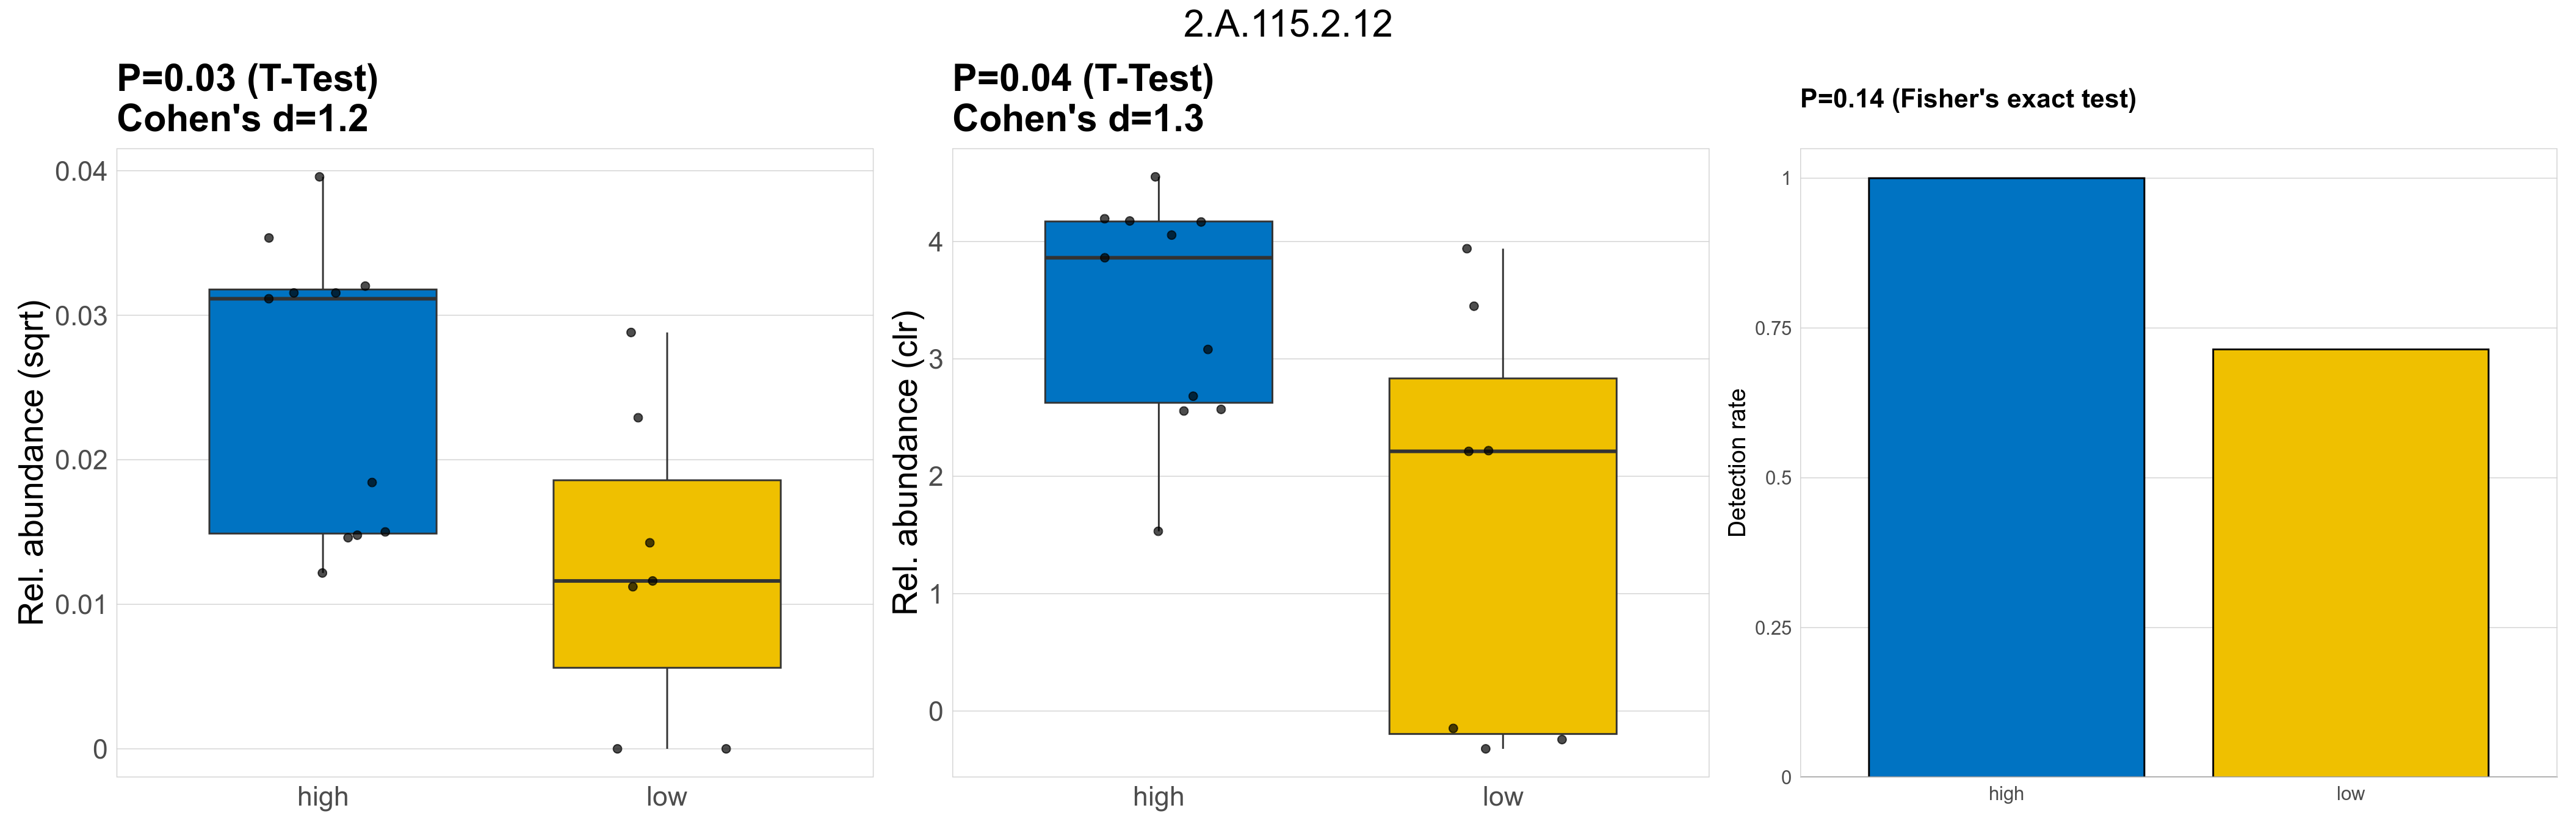
| 2.A.115.2.12 | The Novobiocin Exporter (NbcE) Family | 0.03 | 0.8 | 1 | 1.2 | 0.04 | 1 | 1 | 1.3 | 0.14 | 1 | 1 | 0.12 | 0.9 | 0.14 | 0.92 | 0.00061 | 0.00054 | 0.00028 | 0.00072 | 0.00097 | 5e-04 | 0.00026 | 0.00013 | 0.00031 | -1.5 | 16 / 18 (89%) | 11 / 11 (100%) | 5 / 7 (71%) | 1 | 0.714 |
| 2.A.7.3.12 | The Drug/Metabolite Transporter (DMT) Superfamily | 0.69 | 0.83 | 1 | -0.23 | 0.59 | 1 | 1 | 0.24 | 1 | 1 | 1 | 0.45 | 0.93 | 0.5 | 0.95 | 0.00038 | 6.3e-05 | 0 | 2.9e-05 | 0 | 6.8e-05 | 0.00012 | 0 | 0.00031 | 2 | 3 / 18 (17%) | 2 / 11 (18%) | 1 / 7 (14%) | 0.182 | 0.143 |
| 9.B.126.2.1 | The Putative Lipid IV Exporter (YhjD) Family | 0.56 | 0.8 | 1 | -0.36 | 0.92 | 1 | 1 | 0.043 | 1 | 1 | 1 | 0.5 | 0.93 | 0.54 | 0.95 | 0.00034 | 5.7e-05 | 0 | 1.3e-05 | 0 | 3e-05 | 0.00013 | 0 | 0.00033 | 3.3 | 3 / 18 (17%) | 2 / 11 (18%) | 1 / 7 (14%) | 0.182 | 0.143 |
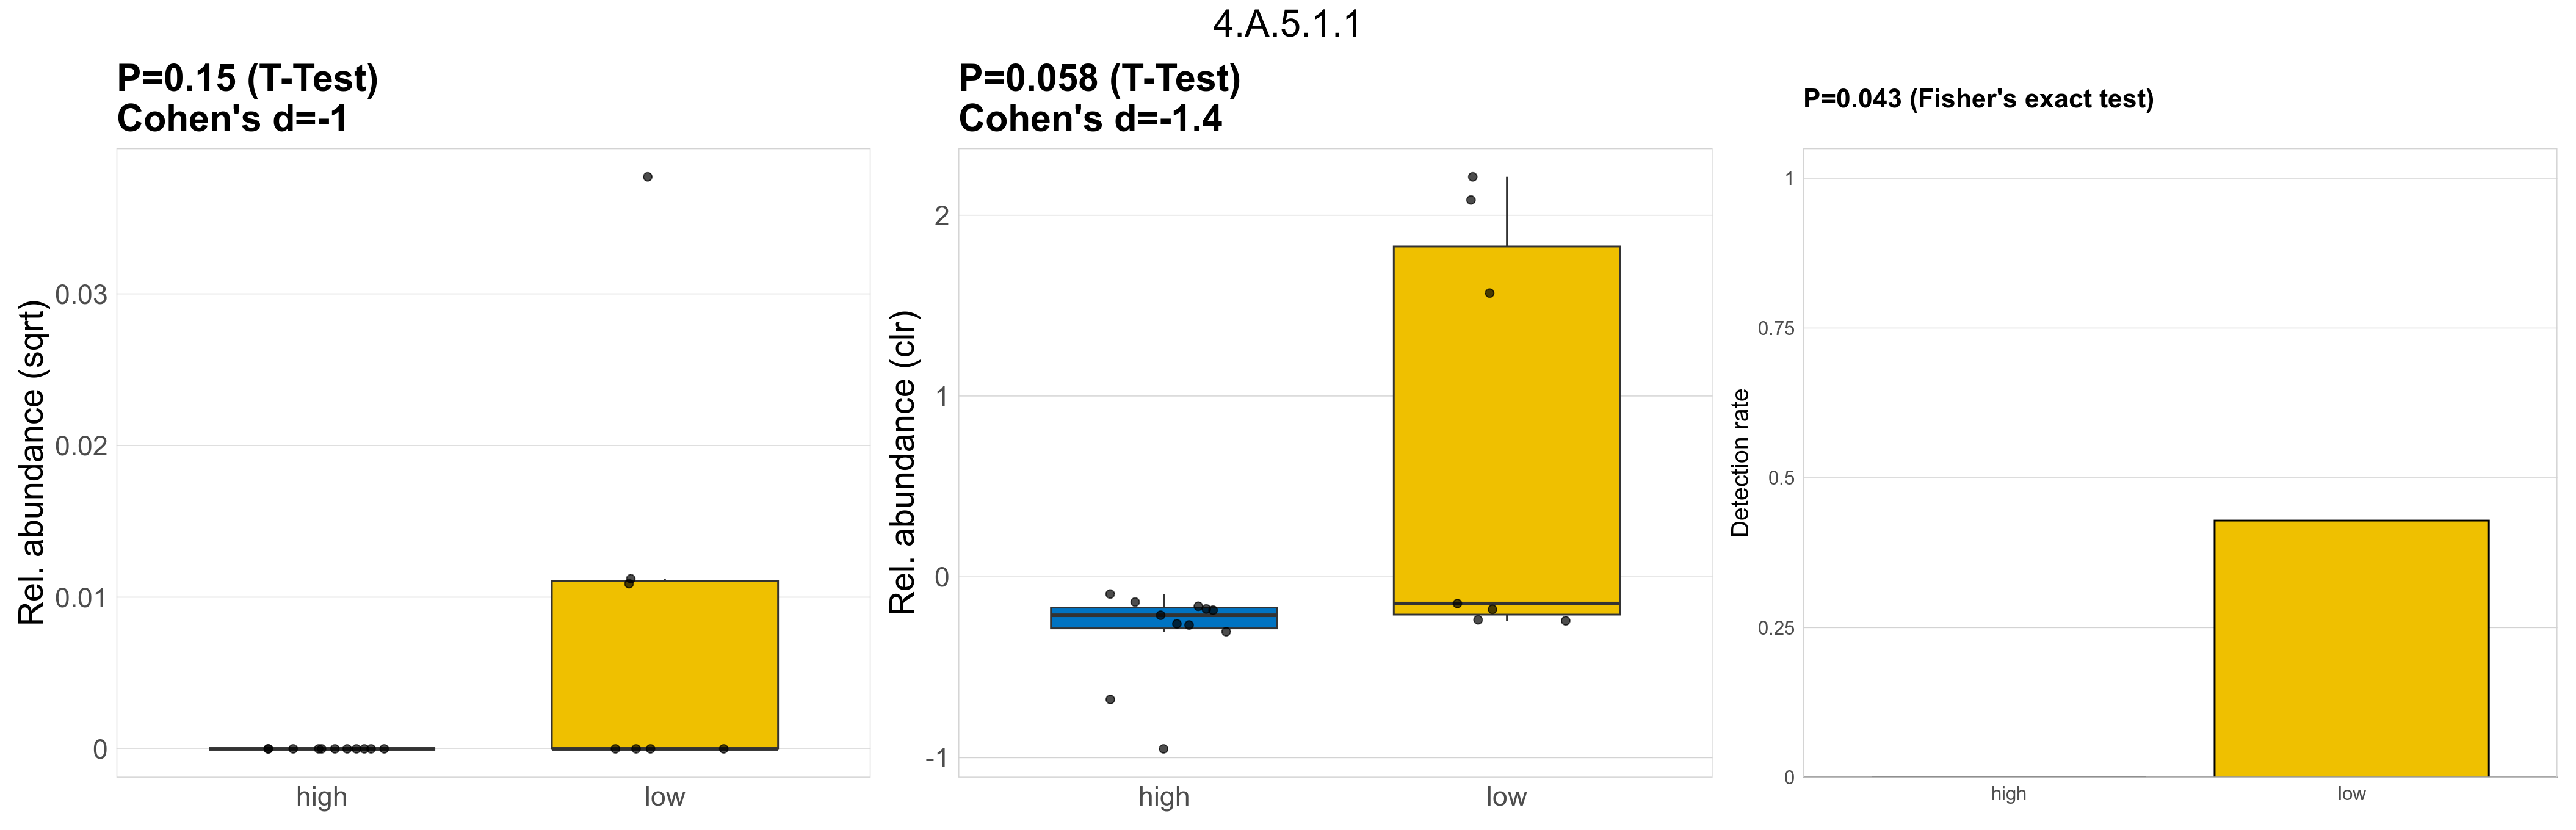
| 4.A.5.1.1 | The PTS Galactitol (Gat) Family | 0.15 | 0.8 | 1 | -1 | 0.058 | 1 | 1 | -1.4 | 0.043 | 1 | 1 | 0.31 | 0.88 | 0.33 | 0.91 | 0.00056 | 9.3e-05 | 0 | 0 | 0 | 0 | 0.00024 | 0 | 0.00053 | Inf | 3 / 18 (17%) | 0 / 11 (0%) | 3 / 7 (43%) | 0 | 0.429 |
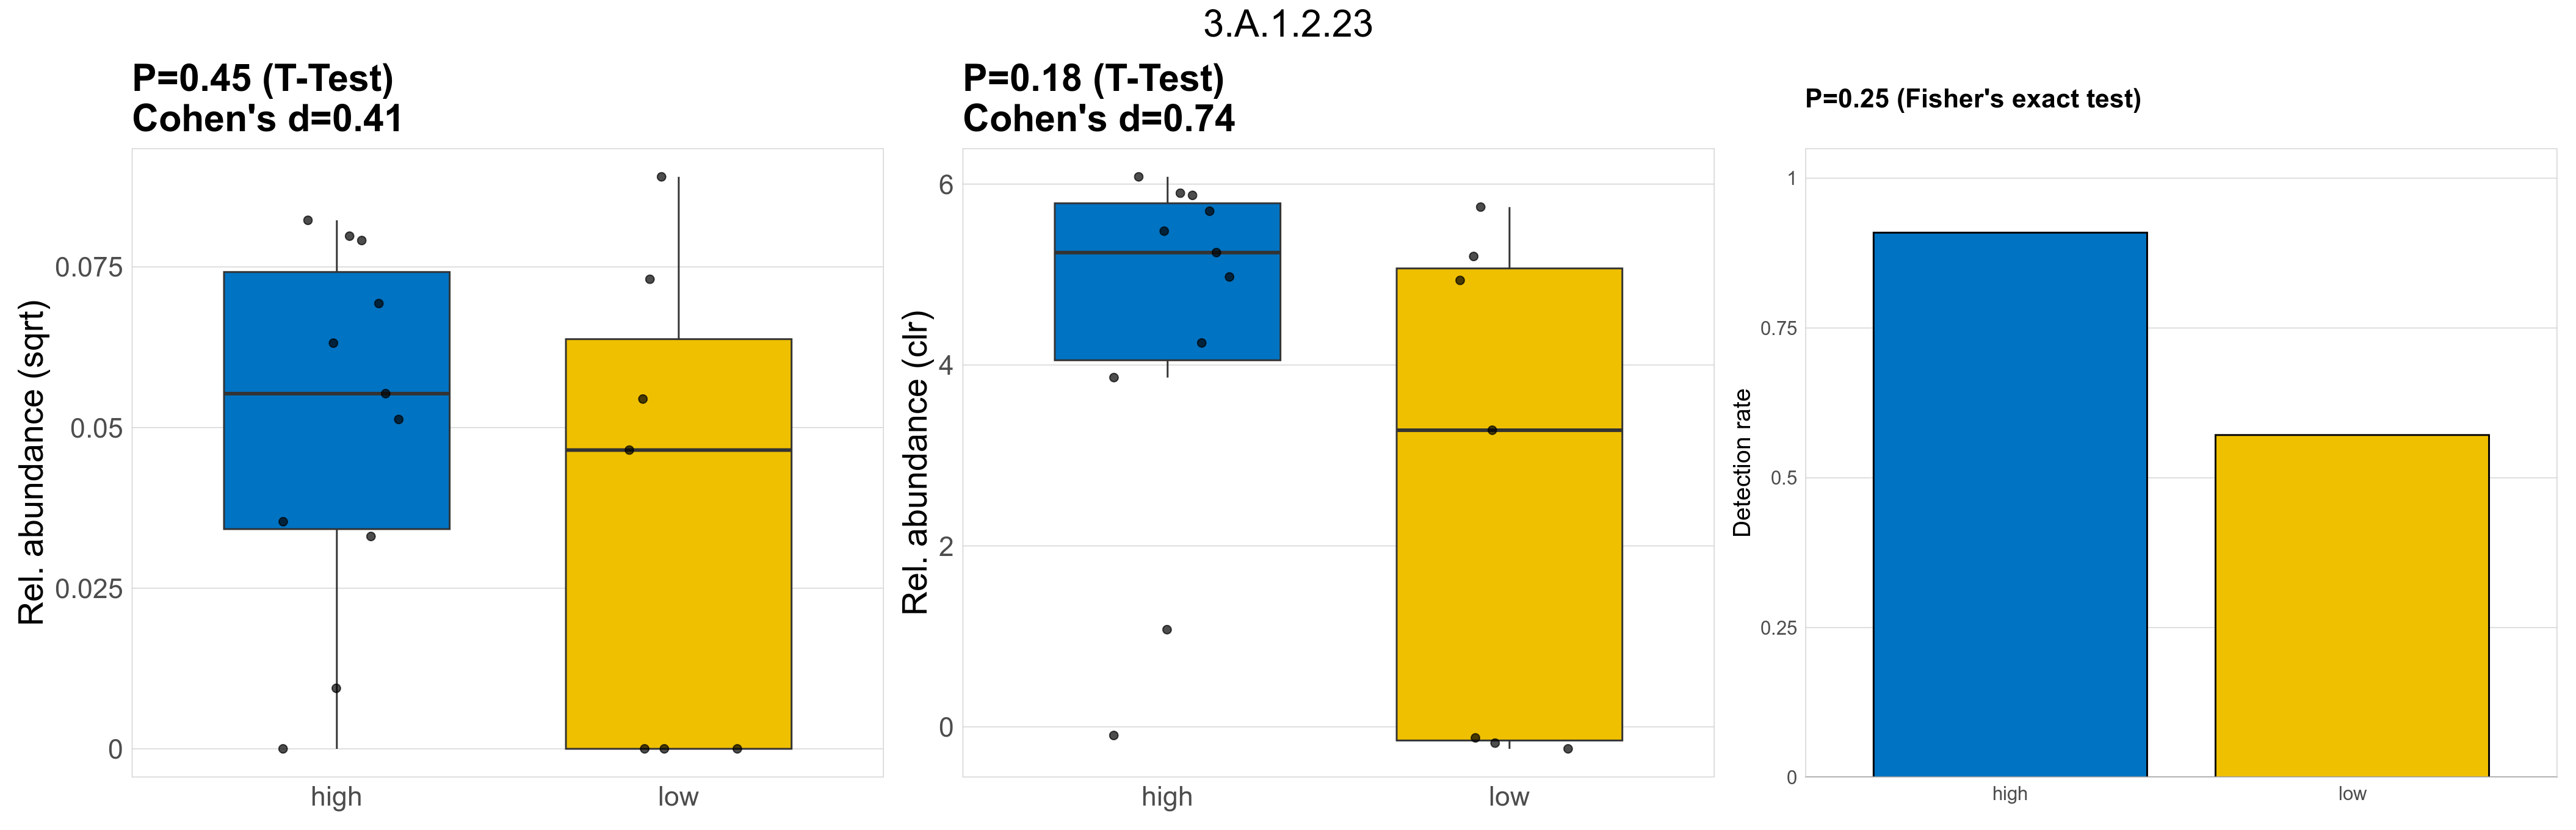
| 3.A.1.2.23 | The ATP-binding Cassette (ABC) Superfamily | 0.45 | 0.8 | 1 | 0.41 | 0.18 | 1 | 1 | 0.74 | 0.25 | 1 | 1 | 0.24 | 0.91 | 0.22 | 0.93 | 0.0039 | 0.003 | 0.0028 | 0.0033 | 0.0031 | 0.0025 | 0.0026 | 0.0022 | 0.0031 | -0.34 | 14 / 18 (78%) | 10 / 11 (91%) | 4 / 7 (57%) | 0.909 | 0.571 |
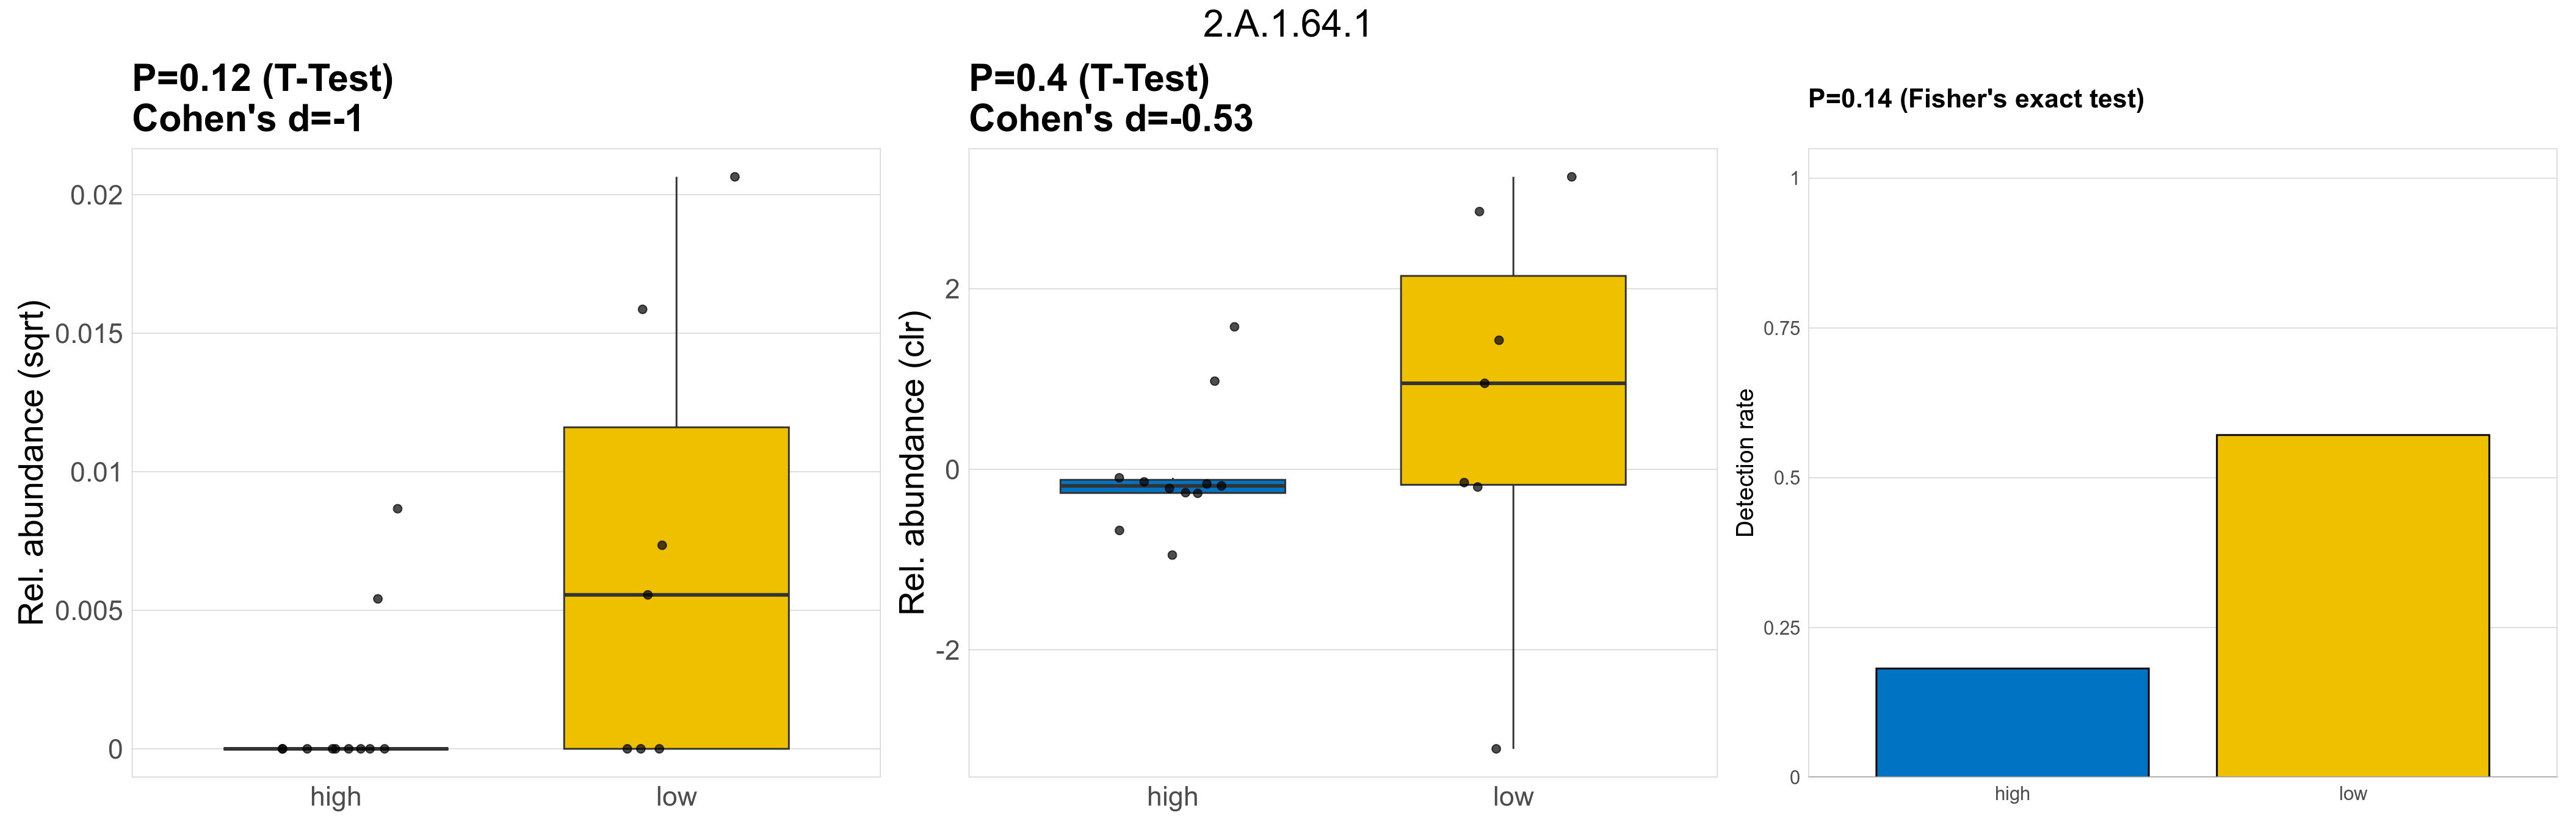
| 2.A.1.64.1 | The Major Facilitator Superfamily (MFS) | 0.12 | 0.8 | 1 | -1 | 0.4 | 1 | 1 | -0.53 | 0.14 | 1 | 1 | 0.44 | 0.93 | 0.33 | 0.94 | 0.00014 | 4.8e-05 | 0 | 9.5e-06 | 0 | 2.3e-05 | 0.00011 | 3.1e-05 | 0.00017 | 3.5 | 6 / 18 (33%) | 2 / 11 (18%) | 4 / 7 (57%) | 0.182 | 0.571 |
| 2.A.10.1.2 | The 2-Keto-3-Deoxygluconate Transporter (KdgT) Family | 0.63 | 0.8 | 1 | -0.29 | 0.63 | 1 | 1 | 0.2 | 1 | 1 | 1 | 0.49 | 0.93 | 0.51 | 0.95 | 2e-04 | 3.4e-05 | 0 | 1.2e-05 | 0 | 2.7e-05 | 6.8e-05 | 0 | 0.00018 | 2.5 | 3 / 18 (17%) | 2 / 11 (18%) | 1 / 7 (14%) | 0.182 | 0.143 |
| 4.C.1.1.4 | The Fatty Acid Transporter (FAT) Family | 0.26 | 0.8 | 1 | -0.75 | 0.25 | 1 | 1 | -0.66 | 0.53 | 1 | 1 | 0.43 | 0.91 | 0.46 | 0.94 | 0.00041 | 6.9e-05 | 0 | 6.8e-06 | 0 | 2.3e-05 | 0.00017 | 0 | 0.00035 | 4.6 | 3 / 18 (17%) | 1 / 11 (9.1%) | 2 / 7 (29%) | 0.0909 | 0.286 |
| 2.A.5.5.5 | The Zinc (Zn2+)-Iron (Fe2+) Permease (ZIP) Family | 0.28 | 0.8 | 1 | -0.61 | 0.42 | 1 | 1 | -0.42 | 0.63 | 1 | 1 | 0.41 | 0.93 | 0.43 | 0.95 | 2e-04 | 8.8e-05 | 0 | 5e-05 | 0 | 8.8e-05 | 0.00015 | 8.1e-05 | 0.00021 | 1.6 | 8 / 18 (44%) | 4 / 11 (36%) | 4 / 7 (57%) | 0.364 | 0.571 |
| 3.A.1.1.1 | The ATP-binding Cassette (ABC) Superfamily | 0.43 | 0.8 | 1 | -0.49 | 0.6 | 1 | 1 | -0.27 | 1 | 1 | 1 | 0.5 | 0.93 | 0.56 | 0.95 | 0.00069 | 0.00015 | 0 | 3.7e-05 | 0 | 8.3e-05 | 0.00034 | 0 | 0.00084 | 3.2 | 4 / 18 (22%) | 2 / 11 (18%) | 2 / 7 (29%) | 0.182 | 0.286 |
| 1.B.57.4.2 | The Legionella Major-Outer Membrane Protein (LM-OMP) Family | 0.97 | 0.98 | 1 | -0.02 | 0.82 | 1 | 1 | 0.12 | 1 | 1 | 1 | 0.62 | 0.95 | 0.65 | 0.97 | 0.00023 | 5e-05 | 0 | 5.9e-05 | 0 | 0.00015 | 3.7e-05 | 0 | 6.5e-05 | -0.67 | 4 / 18 (22%) | 2 / 11 (18%) | 2 / 7 (29%) | 0.182 | 0.286 |
| 2.A.75.1.2 | The L-Lysine Exporter (LysE) Family | 0.28 | 0.8 | 1 | -0.71 | 0.23 | 1 | 1 | -0.77 | 0.53 | 1 | 1 | 0.43 | 0.93 | 0.47 | 0.95 | 0.00033 | 5.5e-05 | 0 | 5.4e-06 | 0 | 1.8e-05 | 0.00013 | 0 | 3e-04 | 4.6 | 3 / 18 (17%) | 1 / 11 (9.1%) | 2 / 7 (29%) | 0.0909 | 0.286 |
| 3.A.1.14.18 | The ATP-binding Cassette (ABC) Superfamily | 0.31 | 0.8 | 1 | -0.66 | 0.27 | 1 | 1 | -0.66 | 0.53 | 1 | 1 | 0.48 | 0.94 | 0.53 | 0.95 | 0.00049 | 8.1e-05 | 0 | 1.1e-05 | 0 | 3.6e-05 | 0.00019 | 0 | 0.00046 | 4.1 | 3 / 18 (17%) | 1 / 11 (9.1%) | 2 / 7 (29%) | 0.0909 | 0.286 |
| 2.A.3.1.23 | The Amino Acid-Polyamine-Organocation (APC) Family | 0.58 | 0.8 | 1 | -0.34 | 0.86 | 1 | 1 | 0.08 | 1 | 1 | 1 | 0.48 | 0.93 | 0.52 | 0.95 | 0.00027 | 4.6e-05 | 0 | 1.3e-05 | 0 | 3.5e-05 | 9.7e-05 | 0 | 0.00026 | 2.9 | 3 / 18 (17%) | 2 / 11 (18%) | 1 / 7 (14%) | 0.182 | 0.143 |
| 2.A.114.1.1 | The Putative Peptide Transporter Carbon Starvation CstA (CstA) Family | 0.39 | 0.8 | 1 | -0.55 | 0.47 | 1 | 1 | -0.4 | 1 | 1 | 1 | 0.51 | 0.94 | 0.53 | 0.96 | 0.00045 | 1e-04 | 0 | 1.8e-05 | 0 | 4.1e-05 | 0.00023 | 0 | 0.00056 | 3.7 | 4 / 18 (22%) | 2 / 11 (18%) | 2 / 7 (29%) | 0.182 | 0.286 |
| 2.A.1.1.115 | The Major Facilitator Superfamily (MFS) | 0.33 | 0.8 | 1 | -0.6 | 0.43 | 1 | 1 | -0.45 | 0.53 | 1 | 1 | 0.51 | 0.94 | 0.56 | 0.96 | 0.00019 | 3.1e-05 | 0 | 1.1e-05 | 0 | 3.6e-05 | 6.4e-05 | 0 | 0.00013 | 2.5 | 3 / 18 (17%) | 1 / 11 (9.1%) | 2 / 7 (29%) | 0.0909 | 0.286 |
| 2.A.41.1.1 | The Concentrative Nucleoside Transporter (CNT) Family | 0.27 | 0.8 | 1 | -0.74 | 0.17 | 1 | 1 | -0.93 | 0.53 | 1 | 1 | 0.41 | 0.92 | 0.46 | 0.95 | 0.00034 | 5.6e-05 | 0 | 2.7e-06 | 0 | 8.9e-06 | 0.00014 | 0 | 0.00033 | 5.7 | 3 / 18 (17%) | 1 / 11 (9.1%) | 2 / 7 (29%) | 0.0909 | 0.286 |
| 1.A.1.13.1 | The Voltage-gated Ion Channel (VIC) Superfamily | 0.57 | 0.8 | 1 | -0.35 | 0.91 | 1 | 1 | 0.051 | 1 | 1 | 1 | 0.53 | 0.94 | 0.54 | 0.96 | 3e-04 | 4.9e-05 | 0 | 1.3e-05 | 0 | 3.5e-05 | 0.00011 | 0 | 0.00028 | 3.1 | 3 / 18 (17%) | 2 / 11 (18%) | 1 / 7 (14%) | 0.182 | 0.143 |
| 3.A.1.5.41 | The ATP-binding Cassette (ABC) Superfamily | 0.62 | 0.8 | 1 | -0.32 | 0.54 | 1 | 1 | 0.31 | 0.6 | 1 | 1 | 0.51 | 0.93 | 0.59 | 0.96 | 8e-04 | 0.00022 | 0 | 4.5e-05 | 0 | 7.4e-05 | 5e-04 | 0 | 0.0013 | 3.5 | 5 / 18 (28%) | 4 / 11 (36%) | 1 / 7 (14%) | 0.364 | 0.143 |
| 3.A.6.2.1 | The Type III (Virulence-related) Secretory Pathway (IIISP) Family | 0.53 | 0.8 | 1 | -0.39 | 0.98 | 1 | 1 | -0.014 | 1 | 1 | 1 | 0.5 | 0.93 | 0.51 | 0.96 | 0.00028 | 4.7e-05 | 0 | 9.5e-06 | 0 | 2.3e-05 | 0.00011 | 0 | 0.00028 | 3.5 | 3 / 18 (17%) | 2 / 11 (18%) | 1 / 7 (14%) | 0.182 | 0.143 |
| 9.A.69.1.1 | The Intermembrane Phospholipid Translocase (IMPL-T) Family | 0.49 | 0.8 | 1 | -0.44 | 0.88 | 1 | 1 | -0.082 | 1 | 1 | 1 | 0.52 | 0.94 | 0.55 | 0.96 | 0.00086 | 0.00014 | 0 | 1.8e-05 | 0 | 4.1e-05 | 0.00034 | 0 | 9e-04 | 4.2 | 3 / 18 (17%) | 2 / 11 (18%) | 1 / 7 (14%) | 0.182 | 0.143 |
| 2.A.21.7.2 | The Solute:Sodium Symporter (SSS) Family | 0.58 | 0.8 | 1 | -0.34 | 0.86 | 1 | 1 | 0.08 | 1 | 1 | 1 | 0.5 | 0.94 | 0.55 | 0.96 | 0.00027 | 4.6e-05 | 0 | 1.3e-05 | 0 | 3.5e-05 | 9.7e-05 | 0 | 0.00026 | 2.9 | 3 / 18 (17%) | 2 / 11 (18%) | 1 / 7 (14%) | 0.182 | 0.143 |
| 3.A.1.2.22 | The ATP-binding Cassette (ABC) Superfamily | 0.36 | 0.8 | 1 | 0.47 | 0.24 | 1 | 1 | 0.61 | 0.53 | 1 | 1 | 0.31 | 0.91 | 0.29 | 0.94 | 0.0034 | 0.0029 | 0.0025 | 0.0033 | 0.0026 | 0.0026 | 0.0022 | 0.002 | 0.0022 | -0.58 | 15 / 18 (83%) | 10 / 11 (91%) | 5 / 7 (71%) | 0.909 | 0.714 |
| 2.A.15.1.4 | The Betaine/Carnitine/Choline Transporter (BCCT) Family | 0.51 | 0.8 | 1 | -0.41 | 0.88 | 1 | 1 | -0.078 | 1 | 1 | 1 | 0.49 | 0.93 | 0.5 | 0.95 | 0.00045 | 7.6e-05 | 0 | 1.3e-05 | 0 | 3.5e-05 | 0.00017 | 0 | 0.00046 | 3.7 | 3 / 18 (17%) | 2 / 11 (18%) | 1 / 7 (14%) | 0.182 | 0.143 |
| 8.A.4.1.1 | The Cytoplasmic Membrane-Periplasmic Auxiliary-2 (MPA2) Family | 0.56 | 0.8 | 1 | -0.37 | 0.96 | 1 | 1 | 0.026 | 1 | 1 | 1 | 0.5 | 0.92 | 0.49 | 0.95 | 0.00032 | 5.3e-05 | 0 | 1.3e-05 | 0 | 3.5e-05 | 0.00012 | 0 | 0.00031 | 3.2 | 3 / 18 (17%) | 2 / 11 (18%) | 1 / 7 (14%) | 0.182 | 0.143 |
| 1.B.11.3.9 | The Outer Membrane Fimbrial Usher Porin (FUP) Family | 0.57 | 0.8 | 1 | -0.35 | 0.89 | 1 | 1 | 0.067 | 1 | 1 | 1 | 0.5 | 0.93 | 0.59 | 0.96 | 0.00051 | 8.5e-05 | 0 | 2.2e-05 | 0 | 5e-05 | 0.00018 | 0 | 0.00049 | 3 | 3 / 18 (17%) | 2 / 11 (18%) | 1 / 7 (14%) | 0.182 | 0.143 |
| 9.A.69.1.2 | The Intermembrane Phospholipid Translocase (IMPL-T) Family | 0.3 | 0.8 | 1 | -0.68 | 0.25 | 1 | 1 | -0.71 | 0.53 | 1 | 1 | 0.49 | 0.92 | 0.51 | 0.95 | 0.00043 | 7.2e-05 | 0 | 8.1e-06 | 0 | 2.7e-05 | 0.00017 | 0 | 4e-04 | 4.4 | 3 / 18 (17%) | 1 / 11 (9.1%) | 2 / 7 (29%) | 0.0909 | 0.286 |
| 2.A.7.3.61 | The Drug/Metabolite Transporter (DMT) Superfamily | 0.66 | 0.81 | 1 | -0.26 | 0.58 | 1 | 1 | 0.24 | 1 | 1 | 1 | 0.57 | 0.94 | 0.59 | 0.95 | 0.00027 | 4.5e-05 | 0 | 1.8e-05 | 0 | 4.1e-05 | 8.7e-05 | 0 | 0.00023 | 2.3 | 3 / 18 (17%) | 2 / 11 (18%) | 1 / 7 (14%) | 0.182 | 0.143 |
| 3.A.1.12.1 | The ATP-binding Cassette (ABC) Superfamily | 0.53 | 0.8 | 1 | -0.4 | 0.94 | 1 | 1 | 0.037 | 1 | 1 | 1 | 0.54 | 0.94 | 0.55 | 0.96 | 0.00052 | 0.00012 | 0 | 1.6e-05 | 0 | 3e-05 | 0.00027 | 0 | 0.00072 | 4.1 | 4 / 18 (22%) | 3 / 11 (27%) | 1 / 7 (14%) | 0.273 | 0.143 |
| 3.A.3.32.6 | The P-type ATPase (P-ATPase) Superfamily | 0.62 | 0.8 | 1 | 0.22 | 0.49 | 1 | 1 | 0.36 | 1 | 1 | 1 | 0.62 | 0.95 | 0.63 | 0.97 | 0.00031 | 5.1e-05 | 0 | 6.7e-05 | 0 | 0.00015 | 2.6e-05 | 0 | 7e-05 | -1.4 | 3 / 18 (17%) | 2 / 11 (18%) | 1 / 7 (14%) | 0.182 | 0.143 |
| 2.A.127.1.2 | The Enterobacterial Cardiolipin Transporter (CLT) Family | 0.55 | 0.8 | 1 | -0.37 | 0.94 | 1 | 1 | 0.035 | 1 | 1 | 1 | 0.54 | 0.94 | 0.56 | 0.96 | 0.00042 | 7e-05 | 0 | 1.6e-05 | 0 | 3.7e-05 | 0.00015 | 0 | 0.00041 | 3.2 | 3 / 18 (17%) | 2 / 11 (18%) | 1 / 7 (14%) | 0.182 | 0.143 |
| 1.A.77.3.5 | The Mg2+/Ca2+ Uniporter (MCU) Family | 0.2 | 0.8 | 1 | -0.75 | 0.57 | 1 | 1 | -0.34 | 0.33 | 1 | 1 | 0.5 | 0.94 | 0.38 | 0.94 | 0.00012 | 4.5e-05 | 0 | 2.2e-05 | 0 | 4.3e-05 | 8.1e-05 | 3.1e-05 | 1e-04 | 1.9 | 7 / 18 (39%) | 3 / 11 (27%) | 4 / 7 (57%) | 0.273 | 0.571 |
| 1.B.1.1.3 | The General Bacterial Porin (GBP) Family | 0.61 | 0.8 | 1 | -0.3 | 0.75 | 1 | 1 | 0.14 | 1 | 1 | 1 | 0.51 | 0.94 | 0.52 | 0.95 | 0.00023 | 3.8e-05 | 0 | 1.3e-05 | 0 | 3.5e-05 | 7.7e-05 | 0 | 2e-04 | 2.6 | 3 / 18 (17%) | 2 / 11 (18%) | 1 / 7 (14%) | 0.182 | 0.143 |
| 3.A.1.106.1 | The ATP-binding Cassette (ABC) Superfamily | 0.74 | 0.85 | 1 | -0.19 | 0.45 | 1 | 1 | 0.32 | 1 | 1 | 1 | 0.53 | 0.94 | 0.57 | 0.96 | 0.00027 | 4.5e-05 | 0 | 2.4e-05 | 0 | 5.3e-05 | 7.7e-05 | 0 | 2e-04 | 1.7 | 3 / 18 (17%) | 2 / 11 (18%) | 1 / 7 (14%) | 0.182 | 0.143 |
| 2.A.85.1.2 | The Aromatic Acid Exporter (ArAE) Family | 0.53 | 0.8 | 1 | -0.4 | 0.97 | 1 | 1 | -0.018 | 1 | 1 | 1 | 0.46 | 0.92 | 0.51 | 0.95 | 0.00051 | 8.5e-05 | 0 | 1.6e-05 | 0 | 3.7e-05 | 0.00019 | 0 | 0.00051 | 3.6 | 3 / 18 (17%) | 2 / 11 (18%) | 1 / 7 (14%) | 0.182 | 0.143 |
| 3.A.1.140.1 | The ATP-binding Cassette (ABC) Superfamily | 0.29 | 0.8 | 1 | -0.71 | 0.21 | 1 | 1 | -0.82 | 0.53 | 1 | 1 | 0.48 | 0.93 | 0.52 | 0.95 | 0.00049 | 8.1e-05 | 0 | 5.4e-06 | 0 | 1.8e-05 | 2e-04 | 0 | 0.00048 | 5.2 | 3 / 18 (17%) | 1 / 11 (9.1%) | 2 / 7 (29%) | 0.0909 | 0.286 |
| 3.A.1.106.20 | The ATP-binding Cassette (ABC) Superfamily | 0.74 | 0.85 | 1 | -0.19 | 0.45 | 1 | 1 | 0.32 | 1 | 1 | 1 | 0.52 | 0.93 | 0.53 | 0.95 | 0.00027 | 4.5e-05 | 0 | 2.4e-05 | 0 | 5.3e-05 | 7.7e-05 | 0 | 2e-04 | 1.7 | 3 / 18 (17%) | 2 / 11 (18%) | 1 / 7 (14%) | 0.182 | 0.143 |
| 2.A.40.7.6 | The Nucleobase/Ascorbate Transporter (NAT) or Nucleobase:Cation Symporter-2 (NCS2) Family | 0.29 | 0.8 | 1 | -0.7 | 0.2 | 1 | 1 | -0.83 | 0.53 | 1 | 1 | 0.45 | 0.93 | 0.46 | 0.94 | 0.00048 | 8.1e-05 | 0 | 5.4e-06 | 0 | 1.8e-05 | 2e-04 | 0 | 0.00048 | 5.2 | 3 / 18 (17%) | 1 / 11 (9.1%) | 2 / 7 (29%) | 0.0909 | 0.286 |
| 1.B.38.4.2 | The Treponema Porin Major Surface Protein (TP-MSP) Family | 0.52 | 0.8 | 1 | 0.28 | 0.38 | 1 | 1 | 0.5 | 1 | 1 | 1 | 0.53 | 0.94 | 0.57 | 0.96 | 7e-05 | 1.2e-05 | 0 | 1.6e-05 | 0 | 3.8e-05 | 4.4e-06 | 0 | 1.2e-05 | -1.9 | 3 / 18 (17%) | 2 / 11 (18%) | 1 / 7 (14%) | 0.182 | 0.143 |
| 2.A.42.1.1 | The Hydroxy/Aromatic Amino Acid Permease (HAAAP) Family | 0.59 | 0.8 | 1 | -0.33 | 0.8 | 1 | 1 | 0.11 | 1 | 1 | 1 | 0.48 | 0.93 | 0.52 | 0.96 | 0.00025 | 4.2e-05 | 0 | 1.3e-05 | 0 | 3.5e-05 | 8.7e-05 | 0 | 0.00023 | 2.7 | 3 / 18 (17%) | 2 / 11 (18%) | 1 / 7 (14%) | 0.182 | 0.143 |
| 1.B.14.8.7 | The Outer Membrane Receptor (OMR) Family | 0.59 | 0.8 | 1 | -0.33 | 0.8 | 1 | 1 | 0.12 | 1 | 1 | 1 | 0.52 | 0.94 | 0.55 | 0.95 | 0.00038 | 6.4e-05 | 0 | 1.8e-05 | 0 | 4.1e-05 | 0.00014 | 0 | 0.00036 | 3 | 3 / 18 (17%) | 2 / 11 (18%) | 1 / 7 (14%) | 0.182 | 0.143 |
| 3.D.1.9.2 | The H+ or Na+-translocating NADH Dehydrogenase (NDH) Family | 0.53 | 0.8 | 1 | -0.39 | 0.99 | 1 | 1 | 0.0073 | 1 | 1 | 1 | 0.48 | 0.92 | 0.52 | 0.94 | 0.00084 | 0.00014 | 0 | 2.6e-05 | 0 | 6.1e-05 | 0.00032 | 0 | 0.00084 | 3.6 | 3 / 18 (17%) | 2 / 11 (18%) | 1 / 7 (14%) | 0.182 | 0.143 |
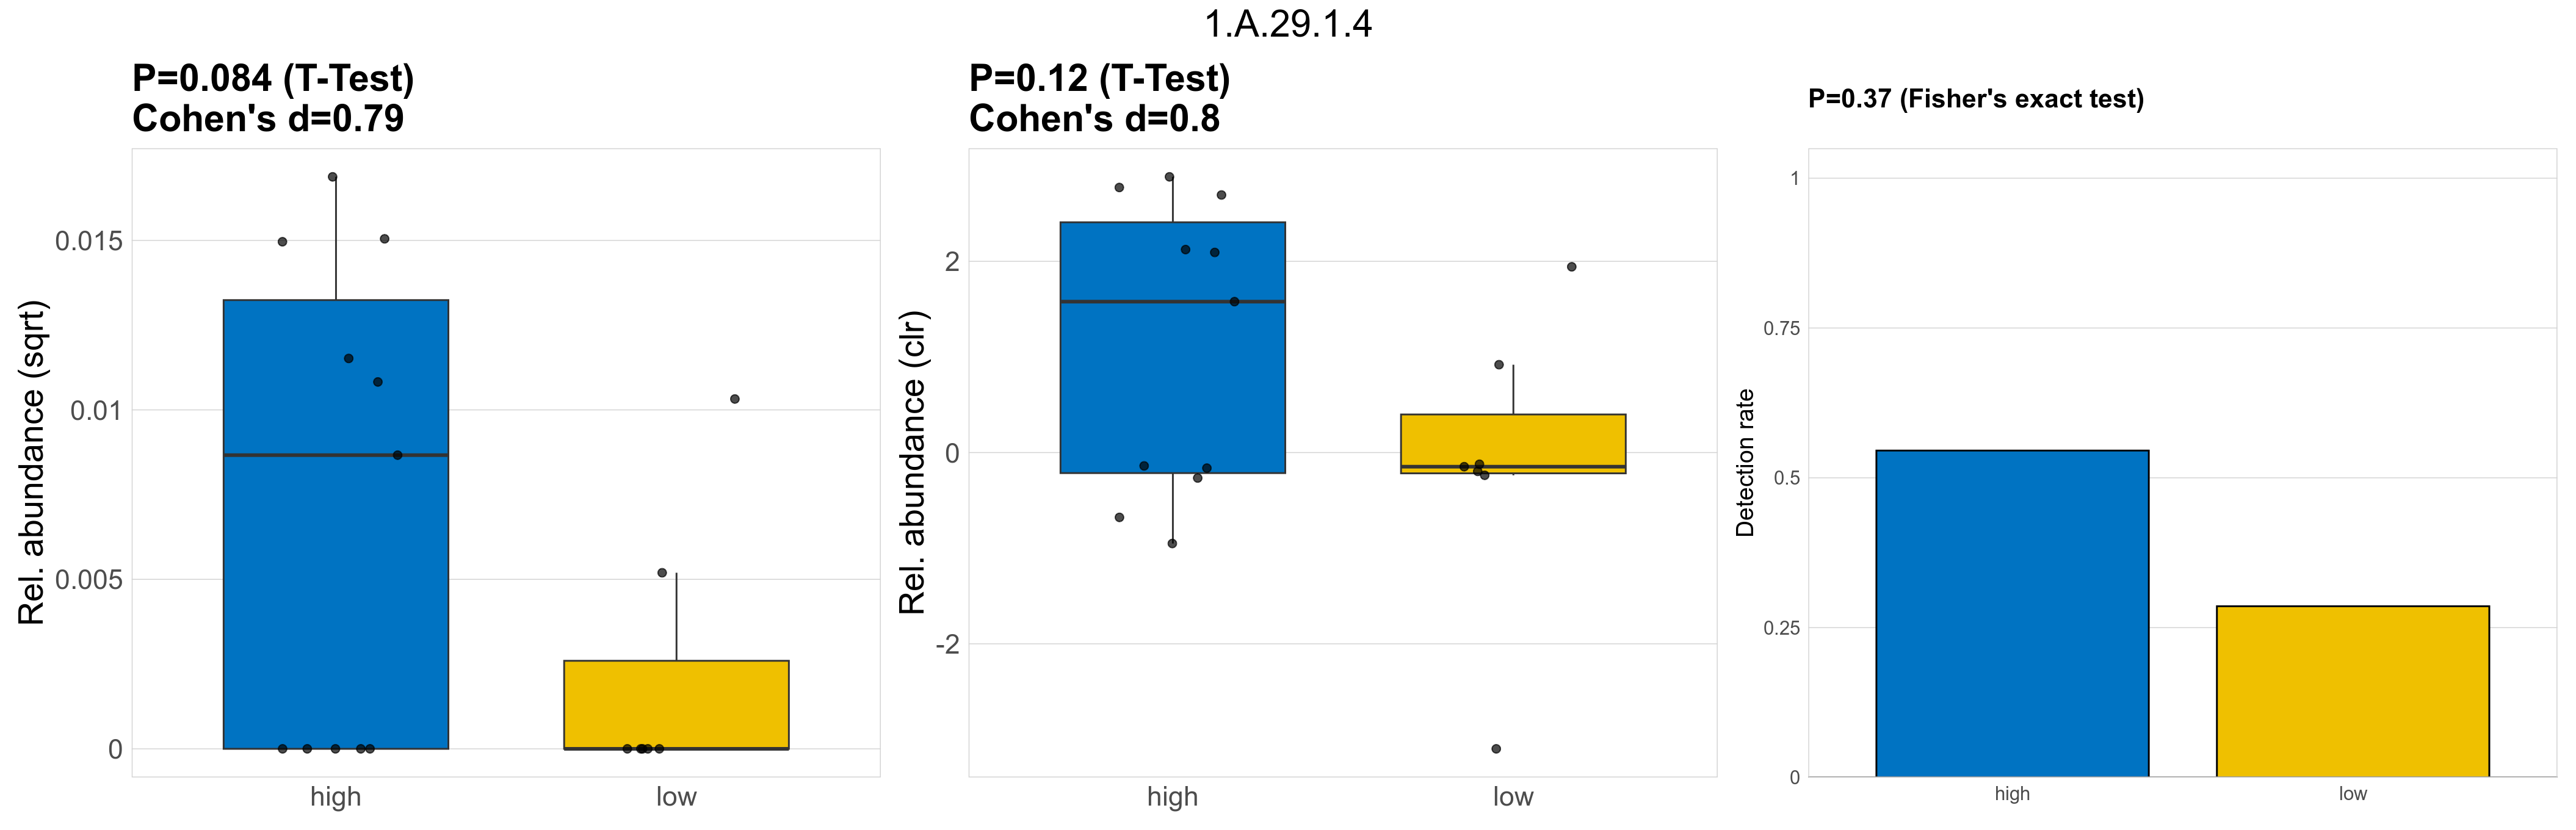
| 1.A.29.1.4 | The Urea/Amide Channel (UAC) Family | 0.084 | 0.8 | 1 | 0.79 | 0.12 | 1 | 1 | 0.8 | 0.37 | 1 | 1 | 0.43 | 0.93 | 0.36 | 0.94 | 0.00015 | 6.6e-05 | 0 | 9.6e-05 | 7.5e-05 | 0.00011 | 1.9e-05 | 0 | 4e-05 | -2.3 | 8 / 18 (44%) | 6 / 11 (55%) | 2 / 7 (29%) | 0.545 | 0.286 |
| 4.C.1.1.16 | The Fatty Acid Transporter (FAT) Family | 0.51 | 0.8 | 1 | -0.41 | 0.88 | 1 | 1 | -0.078 | 1 | 1 | 1 | 0.47 | 0.92 | 0.51 | 0.95 | 0.00045 | 7.6e-05 | 0 | 1.3e-05 | 0 | 3.5e-05 | 0.00017 | 0 | 0.00046 | 3.7 | 3 / 18 (17%) | 2 / 11 (18%) | 1 / 7 (14%) | 0.182 | 0.143 |
| 2.A.20.1.2 | The Inorganic Phosphate Transporter (PiT) Family | 0.27 | 0.8 | 1 | -0.7 | 0.33 | 1 | 1 | -0.53 | 0.53 | 1 | 1 | 0.47 | 0.93 | 0.51 | 0.95 | 0.00033 | 5.6e-05 | 0 | 1e-05 | 0 | 3.4e-05 | 0.00013 | 0 | 0.00026 | 3.7 | 3 / 18 (17%) | 1 / 11 (9.1%) | 2 / 7 (29%) | 0.0909 | 0.286 |
| 2.A.3.7.5 | The Amino Acid-Polyamine-Organocation (APC) Family | 0.58 | 0.8 | 1 | -0.34 | 0.89 | 1 | 1 | 0.066 | 1 | 1 | 1 | 0.52 | 0.94 | 0.54 | 0.96 | 0.00055 | 9.1e-05 | 0 | 2.6e-05 | 0 | 6.9e-05 | 0.00019 | 0 | 0.00051 | 2.9 | 3 / 18 (17%) | 2 / 11 (18%) | 1 / 7 (14%) | 0.182 | 0.143 |
| 9.B.143.2.2 | The 6 TMS DUF1275/Pf06912 (DUF1275) Family | 0.99 | 0.99 | 1 | -0.0059 | 0.72 | 1 | 1 | 0.19 | 1 | 1 | 1 | 0.62 | 0.95 | 0.66 | 0.97 | 0.00013 | 3.6e-05 | 0 | 3.6e-05 | 0 | 6.8e-05 | 3.4e-05 | 0 | 5.9e-05 | -0.082 | 5 / 18 (28%) | 3 / 11 (27%) | 2 / 7 (29%) | 0.273 | 0.286 |
| 1.B.42.1.2 | The Outer Membrane Lipopolysaccharide Export Porin (LPS-EP) Family | 0.49 | 0.8 | 1 | -0.44 | 0.89 | 1 | 1 | -0.071 | 1 | 1 | 1 | 0.54 | 0.93 | 0.64 | 0.96 | 0.0015 | 0.00042 | 0 | 7.6e-05 | 0 | 0.00015 | 0.00095 | 0 | 0.0025 | 3.6 | 5 / 18 (28%) | 3 / 11 (27%) | 2 / 7 (29%) | 0.273 | 0.286 |
| 2.A.73.1.1 | The Short Chain Fatty Acid Uptake (AtoE) Family | 0.55 | 0.8 | 1 | -0.37 | 0.94 | 1 | 1 | 0.033 | 1 | 1 | 1 | 0.48 | 0.93 | 0.54 | 0.95 | 0.00024 | 3.9e-05 | 0 | 9.2e-06 | 0 | 2.2e-05 | 8.7e-05 | 0 | 0.00023 | 3.2 | 3 / 18 (17%) | 2 / 11 (18%) | 1 / 7 (14%) | 0.182 | 0.143 |
| 4.D.3.1.6 | The Glycan Glucosyl Transferase (OpgH) Family | 0.6 | 0.8 | 1 | -0.33 | 0.69 | 1 | 1 | 0.2 | 1 | 1 | 1 | 0.53 | 0.93 | 0.57 | 0.96 | 0.00065 | 0.00014 | 0 | 3.1e-05 | 0 | 5.5e-05 | 0.00032 | 0 | 0.00084 | 3.4 | 4 / 18 (22%) | 3 / 11 (27%) | 1 / 7 (14%) | 0.273 | 0.143 |
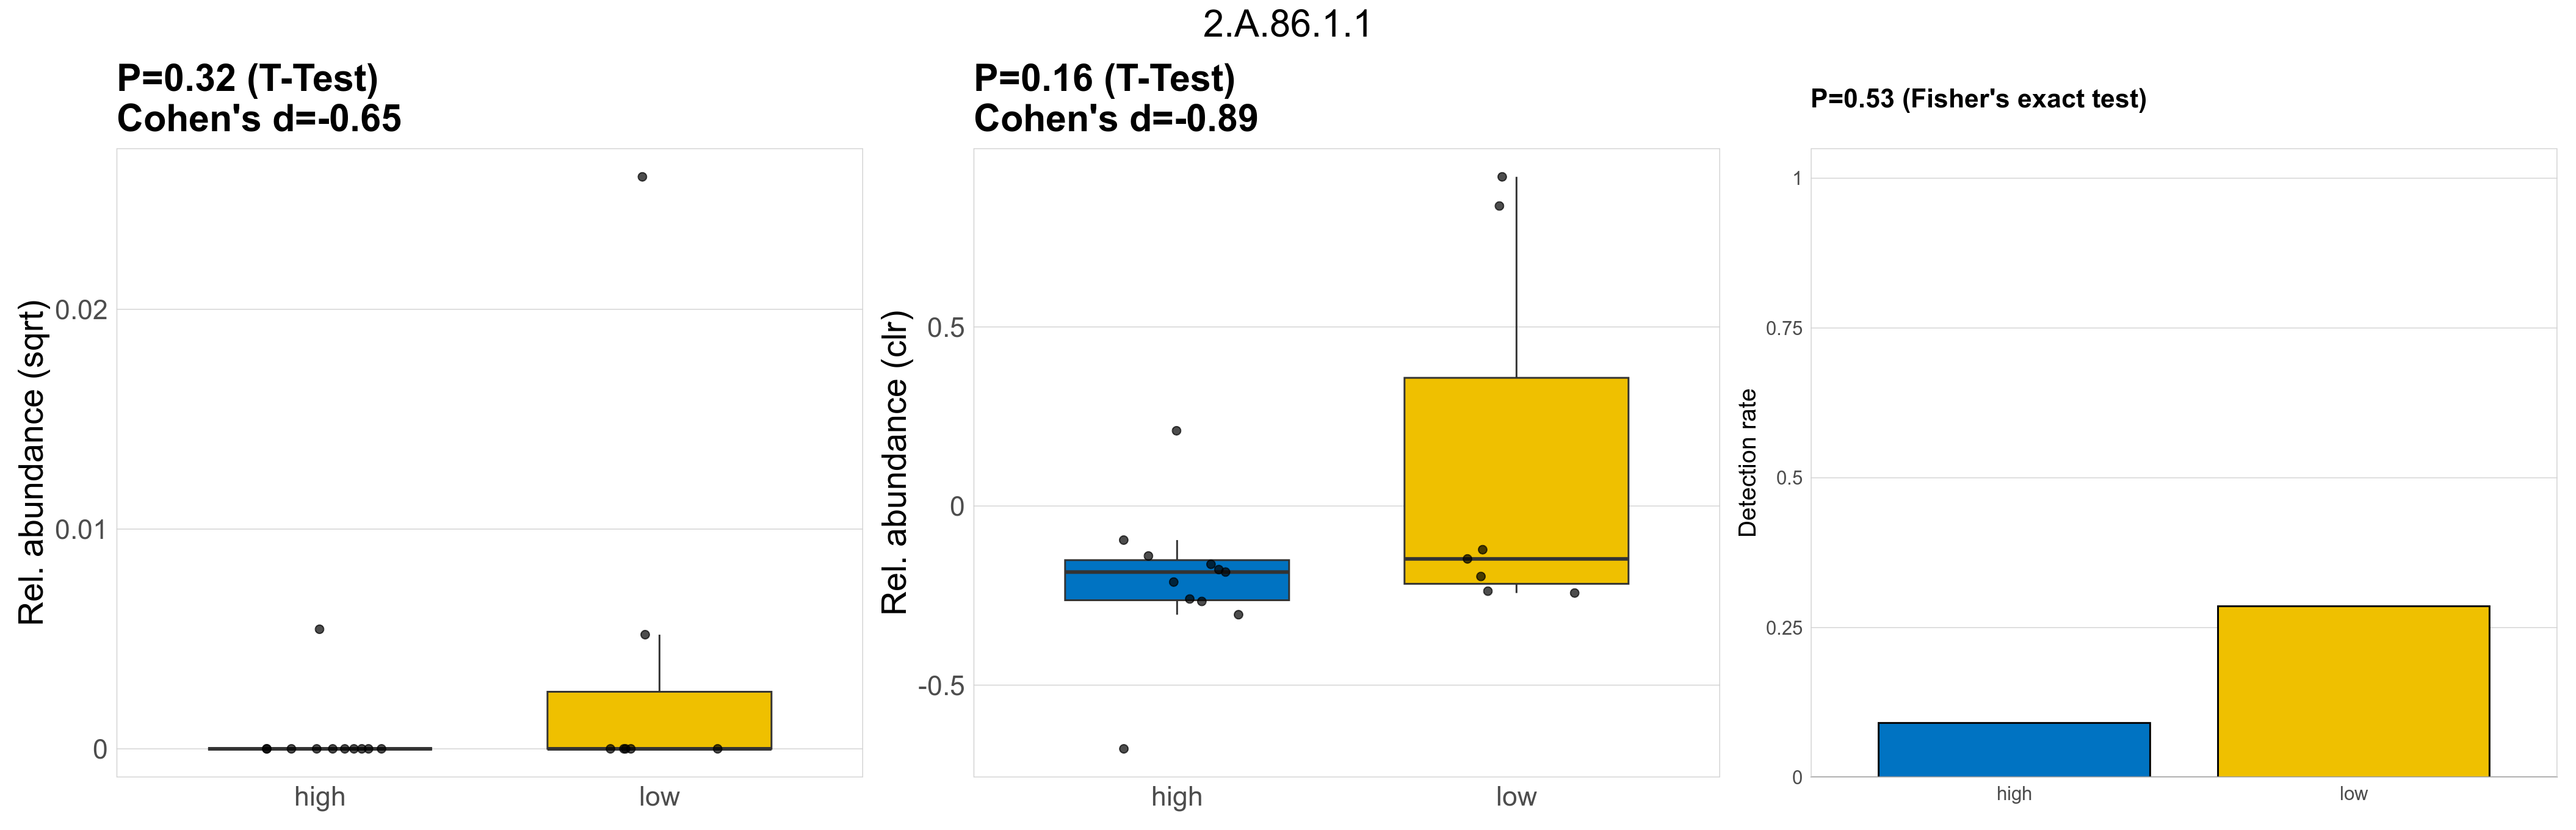
| 2.A.86.1.1 | The Autoinducer-2 Exporter (AI-2E) Family (Formerly the PerM Family. TC #9.B.22) | 0.32 | 0.8 | 1 | -0.65 | 0.16 | 1 | 1 | -0.89 | 0.53 | 1 | 1 | 0.46 | 0.92 | 0.51 | 0.94 | 0.00024 | 4.1e-05 | 0 | 2.7e-06 | 0 | 8.9e-06 | 1e-04 | 0 | 0.00025 | 5.2 | 3 / 18 (17%) | 1 / 11 (9.1%) | 2 / 7 (29%) | 0.0909 | 0.286 |
| 3.A.1.3.4 | The ATP-binding Cassette (ABC) Superfamily | 0.41 | 0.8 | 1 | -0.53 | 0.53 | 1 | 1 | -0.34 | 1 | 1 | 1 | 0.53 | 0.94 | 0.53 | 0.96 | 0.00059 | 0.00013 | 0 | 2.6e-05 | 0 | 6.1e-05 | 3e-04 | 0 | 0.00074 | 3.5 | 4 / 18 (22%) | 2 / 11 (18%) | 2 / 7 (29%) | 0.182 | 0.286 |
| 3.A.1.3.10 | The ATP-binding Cassette (ABC) Superfamily | 0.56 | 0.8 | 1 | -0.36 | 0.91 | 1 | 1 | 0.052 | 1 | 1 | 1 | 0.49 | 0.93 | 0.54 | 0.96 | 4e-04 | 6.6e-05 | 0 | 1.6e-05 | 0 | 3.7e-05 | 0.00015 | 0 | 0.00038 | 3.2 | 3 / 18 (17%) | 2 / 11 (18%) | 1 / 7 (14%) | 0.182 | 0.143 |
| 2.A.38.1.1 | The K+ Transporter (Trk) Family | 0.55 | 0.8 | 1 | -0.37 | 0.92 | 1 | 1 | 0.049 | 1 | 1 | 1 | 0.5 | 0.94 | 0.56 | 0.96 | 0.00049 | 0.00014 | 0 | 3.6e-05 | 0 | 6.9e-05 | 0.00029 | 0 | 0.00077 | 3 | 5 / 18 (28%) | 3 / 11 (27%) | 2 / 7 (29%) | 0.273 | 0.286 |
| 5.A.3.1.2 | The Prokaryotic Molybdopterin-containing Oxidoreductase (PMO) Family | 0.55 | 0.8 | 1 | -0.37 | 0.91 | 1 | 1 | 0.057 | 1 | 1 | 1 | 0.53 | 0.93 | 0.58 | 0.95 | 0.00051 | 0.00014 | 0 | 3.7e-05 | 0 | 6.3e-05 | 3e-04 | 0 | 0.00079 | 3 | 5 / 18 (28%) | 3 / 11 (27%) | 2 / 7 (29%) | 0.273 | 0.286 |
| 1.B.1.1.2 | The General Bacterial Porin (GBP) Family | 0.28 | 0.8 | 1 | -0.71 | 0.23 | 1 | 1 | -0.75 | 0.53 | 1 | 1 | 0.49 | 0.92 | 0.53 | 0.96 | 0.00028 | 4.7e-05 | 0 | 5.4e-06 | 0 | 1.8e-05 | 0.00011 | 0 | 0.00025 | 4.3 | 3 / 18 (17%) | 1 / 11 (9.1%) | 2 / 7 (29%) | 0.0909 | 0.286 |
| 2.A.28.2.6 | The Bile Acid:Na+ Symporter (BASS) Family | 0.5 | 0.8 | 1 | 0.32 | 0.48 | 1 | 1 | 0.34 | 1 | 1 | 1 | 0.55 | 0.94 | 0.46 | 0.95 | 7e-04 | 0.00051 | 0.00046 | 6e-04 | 0.00053 | 0.00054 | 0.00037 | 0.00034 | 0.00039 | -0.7 | 13 / 18 (72%) | 8 / 11 (73%) | 5 / 7 (71%) | 0.727 | 0.714 |
| 2.A.72.1.1 | The K+ Uptake Permease (KUP) Family | 0.4 | 0.8 | 1 | -0.52 | 0.62 | 1 | 1 | -0.27 | 1 | 1 | 1 | 0.49 | 0.93 | 0.52 | 0.95 | 0.00026 | 7.3e-05 | 0 | 1.9e-05 | 0 | 3.8e-05 | 0.00016 | 0 | 0.00033 | 3.1 | 5 / 18 (28%) | 3 / 11 (27%) | 2 / 7 (29%) | 0.273 | 0.286 |
| 1.A.104.1.1 | The Proposed Flagellar Biosynthesis Na+ Channel. FlaH (FlaH) Family | 0.53 | 0.8 | 1 | -0.39 | 0.98 | 1 | 1 | -0.014 | 1 | 1 | 1 | 0.53 | 0.94 | 0.56 | 0.96 | 0.00028 | 4.7e-05 | 0 | 9.5e-06 | 0 | 2.3e-05 | 0.00011 | 0 | 0.00028 | 3.5 | 3 / 18 (17%) | 2 / 11 (18%) | 1 / 7 (14%) | 0.182 | 0.143 |
| 2.A.35.1.8 | The NhaC Na+:H+ Antiporter (NhaC) Family | 0.49 | 0.8 | 1 | 0.29 | 0.49 | 1 | 1 | 0.36 | 1 | 1 | 1 | 0.59 | 0.95 | 0.65 | 0.97 | 0.00036 | 0.00014 | 0 | 2e-04 | 0 | 5e-04 | 4.9e-05 | 0 | 9.2e-05 | -2 | 7 / 18 (39%) | 4 / 11 (36%) | 3 / 7 (43%) | 0.364 | 0.429 |
| 3.A.1.5.3 | The ATP-binding Cassette (ABC) Superfamily | 0.58 | 0.8 | 1 | -0.34 | 0.86 | 1 | 1 | 0.087 | 1 | 1 | 1 | 0.52 | 0.94 | 0.56 | 0.96 | 0.00089 | 0.00015 | 0 | 3.9e-05 | 0 | 8.8e-05 | 0.00032 | 0 | 0.00084 | 3 | 3 / 18 (17%) | 2 / 11 (18%) | 1 / 7 (14%) | 0.182 | 0.143 |
| 3.A.5.1.1 | The General Secretory Pathway (Sec) Family | 0.49 | 0.8 | 1 | -0.44 | 0.92 | 1 | 1 | -0.053 | 1 | 1 | 1 | 0.53 | 0.94 | 0.57 | 0.96 | 0.0016 | 0.00027 | 0 | 3.4e-05 | 0 | 7.8e-05 | 0.00064 | 0 | 0.0017 | 4.2 | 3 / 18 (17%) | 2 / 11 (18%) | 1 / 7 (14%) | 0.182 | 0.143 |
| 3.D.6.1.4 | The Putative Ion (H+ or Na+)-translocating NADH:Ferredoxin Oxidoreductase (NFO or RNF) Family | 0.33 | 0.8 | 1 | -0.65 | 0.18 | 1 | 1 | -0.89 | 0.53 | 1 | 1 | 0.45 | 0.92 | 0.46 | 0.94 | 0.00056 | 9.3e-05 | 0 | 2.7e-06 | 0 | 8.9e-06 | 0.00024 | 0 | 0.00061 | 6.5 | 3 / 18 (17%) | 1 / 11 (9.1%) | 2 / 7 (29%) | 0.0909 | 0.286 |
Click here to open full-sized image in new window.
Click here to open full-sized image in new window.
Click here to open full-sized image in new window.
P Fisher's exact test: differences in detection rate were detected by Fisher's exact test.
P Welch's t-test (sqrt): Differentially abundant functions were identified by Welch's t-test.
P Welch's t-test (clr): Differentially abundant functions were identified by Welch's t-test.
The following plots present the distribution of the top most differentially abundant microbial functions across all applied statistical analysis. Plots are ordered alphabetically.